Yaqui vs Latvian Disability
COMPARE
Yaqui
Latvian
Disability
Disability Comparison
Yaqui
Latvians
13.1%
DISABILITY
0.0/ 100
METRIC RATING
291st/ 347
METRIC RANK
11.4%
DISABILITY
89.8/ 100
METRIC RATING
130th/ 347
METRIC RANK
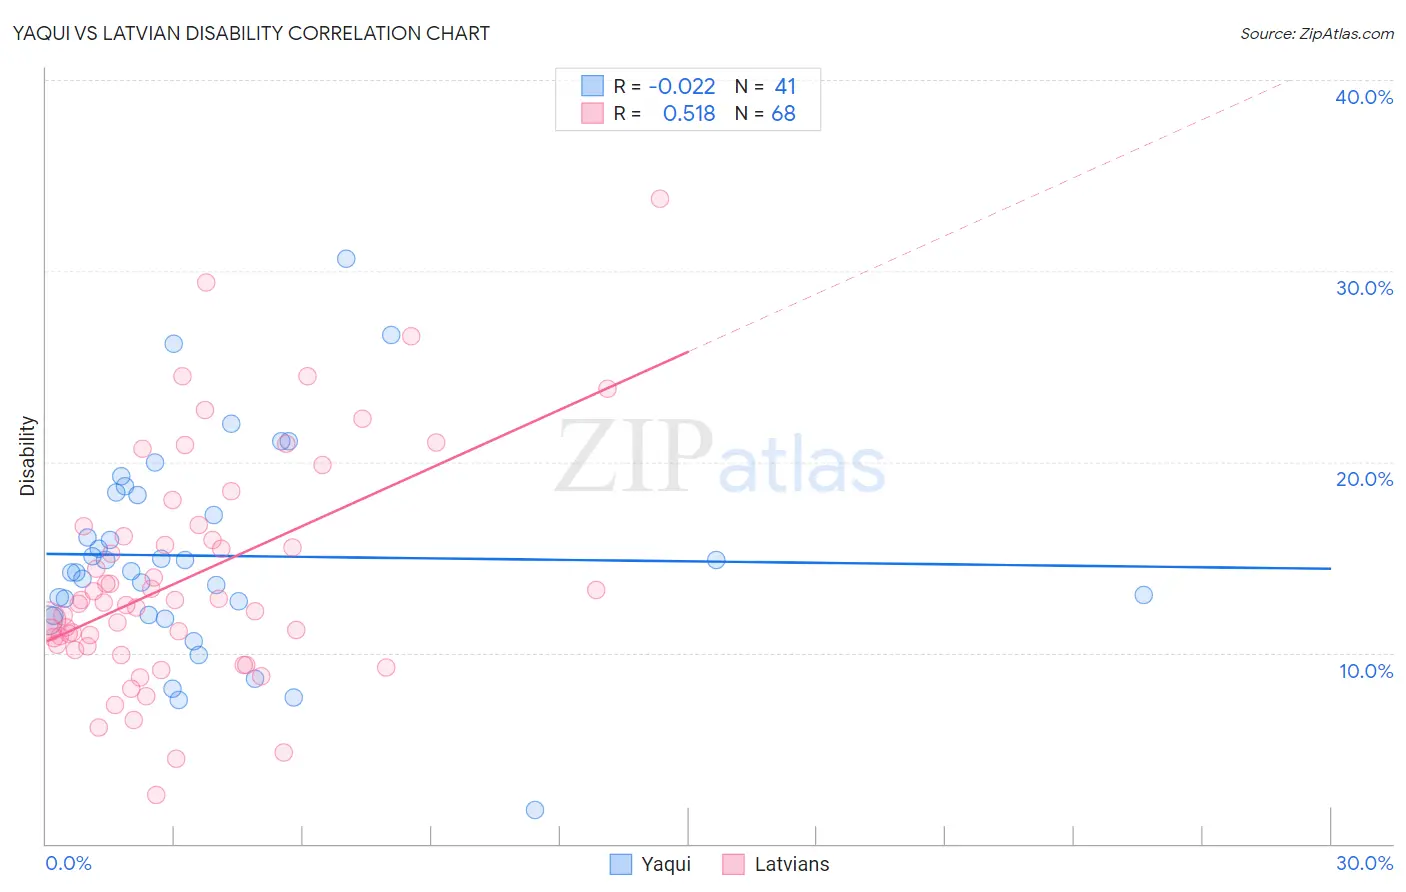
Yaqui vs Latvian Disability Correlation Chart
The statistical analysis conducted on geographies consisting of 107,721,250 people shows no correlation between the proportion of Yaqui and percentage of population with a disability in the United States with a correlation coefficient (R) of -0.022 and weighted average of 13.1%. Similarly, the statistical analysis conducted on geographies consisting of 220,718,032 people shows a substantial positive correlation between the proportion of Latvians and percentage of population with a disability in the United States with a correlation coefficient (R) of 0.518 and weighted average of 11.4%, a difference of 14.3%.
Disability Correlation Summary
| Measurement | Yaqui | Latvian |
| Minimum | 1.8% | 2.6% |
| Maximum | 30.6% | 33.8% |
| Range | 28.9% | 31.2% |
| Mean | 15.1% | 13.9% |
| Median | 14.3% | 12.6% |
| Interquartile 25% (IQ1) | 12.0% | 10.4% |
| Interquartile 75% (IQ3) | 18.3% | 16.4% |
| Interquartile Range (IQR) | 6.3% | 6.0% |
| Standard Deviation (Sample) | 5.5% | 6.0% |
| Standard Deviation (Population) | 5.4% | 5.9% |
Similar Demographics by Disability
Demographics Similar to Yaqui by Disability
In terms of disability, the demographic groups most similar to Yaqui are Cheyenne (13.0%, a difference of 0.23%), Slovak (13.0%, a difference of 0.28%), White/Caucasian (13.0%, a difference of 0.29%), African (13.0%, a difference of 0.31%), and Aleut (13.1%, a difference of 0.36%).
| Demographics | Rating | Rank | Disability |
| Welsh | 0.0 /100 | #284 | Tragic 12.9% |
| Crow | 0.0 /100 | #285 | Tragic 12.9% |
| English | 0.0 /100 | #286 | Tragic 13.0% |
| Africans | 0.0 /100 | #287 | Tragic 13.0% |
| Whites/Caucasians | 0.0 /100 | #288 | Tragic 13.0% |
| Slovaks | 0.0 /100 | #289 | Tragic 13.0% |
| Cheyenne | 0.0 /100 | #290 | Tragic 13.0% |
| Yaqui | 0.0 /100 | #291 | Tragic 13.1% |
| Aleuts | 0.0 /100 | #292 | Tragic 13.1% |
| Marshallese | 0.0 /100 | #293 | Tragic 13.1% |
| Celtics | 0.0 /100 | #294 | Tragic 13.1% |
| Immigrants | Nonimmigrants | 0.0 /100 | #295 | Tragic 13.2% |
| Central American Indians | 0.0 /100 | #296 | Tragic 13.2% |
| Hopi | 0.0 /100 | #297 | Tragic 13.2% |
| Alaska Natives | 0.0 /100 | #298 | Tragic 13.2% |
Demographics Similar to Latvians by Disability
In terms of disability, the demographic groups most similar to Latvians are Immigrants from Croatia (11.4%, a difference of 0.010%), Macedonian (11.4%, a difference of 0.060%), Immigrants from Italy (11.4%, a difference of 0.070%), Immigrants from Europe (11.4%, a difference of 0.070%), and Immigrants from Africa (11.4%, a difference of 0.070%).
| Demographics | Rating | Rank | Disability |
| South Africans | 92.3 /100 | #123 | Exceptional 11.4% |
| South American Indians | 92.2 /100 | #124 | Exceptional 11.4% |
| Costa Ricans | 91.9 /100 | #125 | Exceptional 11.4% |
| Immigrants | Latvia | 90.9 /100 | #126 | Exceptional 11.4% |
| Immigrants | Italy | 90.4 /100 | #127 | Exceptional 11.4% |
| Immigrants | Europe | 90.4 /100 | #128 | Exceptional 11.4% |
| Macedonians | 90.3 /100 | #129 | Exceptional 11.4% |
| Latvians | 89.8 /100 | #130 | Excellent 11.4% |
| Immigrants | Croatia | 89.8 /100 | #131 | Excellent 11.4% |
| Immigrants | Africa | 89.3 /100 | #132 | Excellent 11.4% |
| Arabs | 89.1 /100 | #133 | Excellent 11.4% |
| Immigrants | Guyana | 88.3 /100 | #134 | Excellent 11.4% |
| Ugandans | 87.9 /100 | #135 | Excellent 11.4% |
| Immigrants | St. Vincent and the Grenadines | 87.8 /100 | #136 | Excellent 11.4% |
| Kenyans | 87.1 /100 | #137 | Excellent 11.5% |