Yaqui vs Fijian Male Disability
COMPARE
Yaqui
Fijian
Male Disability
Male Disability Comparison
Yaqui
Fijians
12.9%
MALE DISABILITY
0.0/ 100
METRIC RATING
293rd/ 347
METRIC RANK
12.6%
MALE DISABILITY
0.0/ 100
METRIC RATING
275th/ 347
METRIC RANK
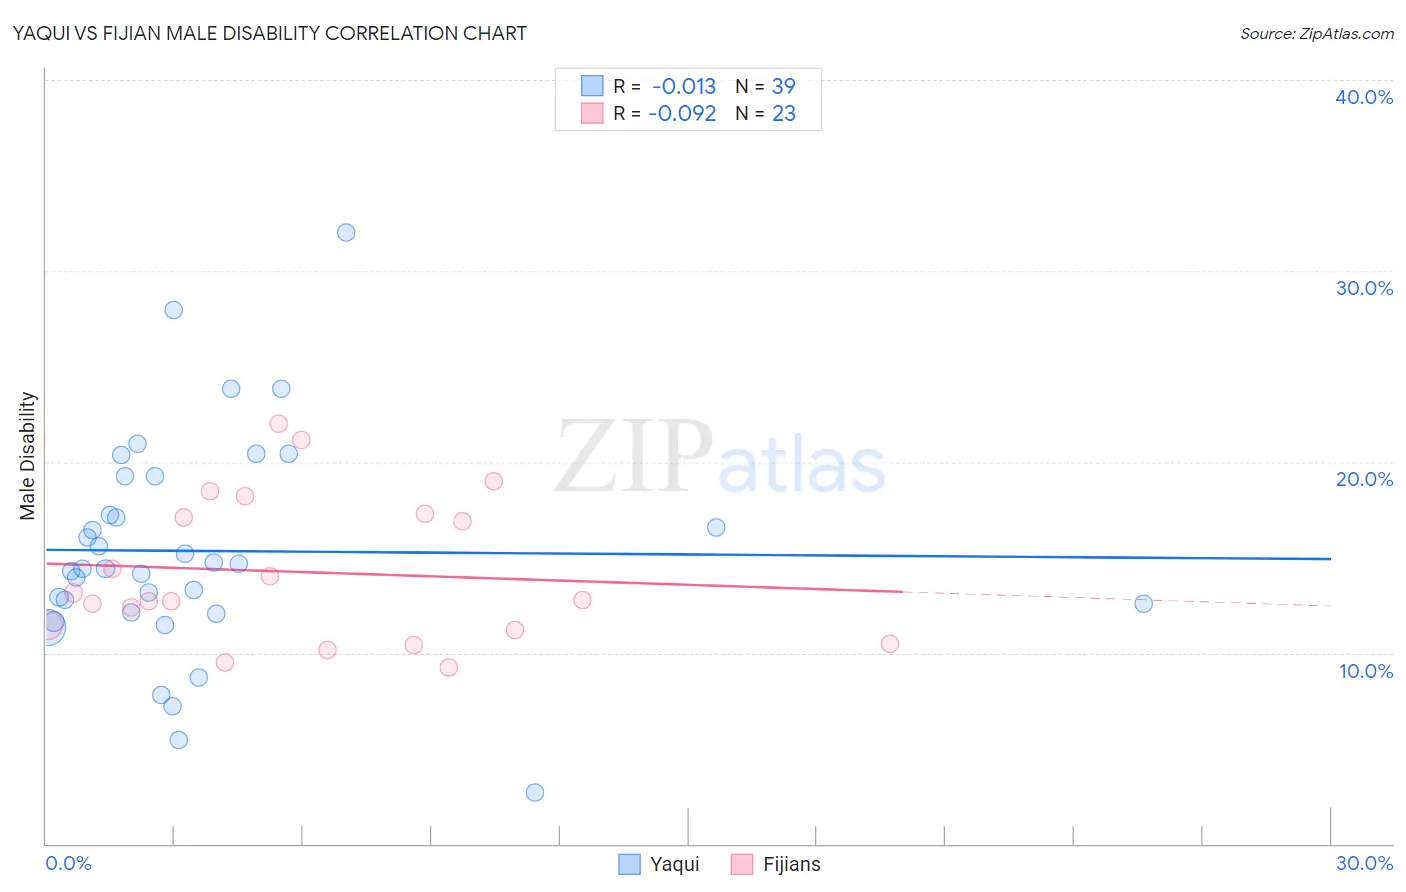
Yaqui vs Fijian Male Disability Correlation Chart
The statistical analysis conducted on geographies consisting of 107,718,967 people shows no correlation between the proportion of Yaqui and percentage of males with a disability in the United States with a correlation coefficient (R) of -0.013 and weighted average of 12.9%. Similarly, the statistical analysis conducted on geographies consisting of 55,947,896 people shows a slight negative correlation between the proportion of Fijians and percentage of males with a disability in the United States with a correlation coefficient (R) of -0.092 and weighted average of 12.6%, a difference of 2.6%.
Male Disability Correlation Summary
| Measurement | Yaqui | Fijian |
| Minimum | 2.7% | 9.2% |
| Maximum | 32.0% | 22.0% |
| Range | 29.3% | 12.7% |
| Mean | 15.3% | 14.2% |
| Median | 14.4% | 12.8% |
| Interquartile 25% (IQ1) | 12.1% | 11.2% |
| Interquartile 75% (IQ3) | 19.2% | 17.3% |
| Interquartile Range (IQR) | 7.1% | 6.0% |
| Standard Deviation (Sample) | 5.8% | 3.8% |
| Standard Deviation (Population) | 5.7% | 3.7% |
Demographics Similar to Yaqui and Fijians by Male Disability
In terms of male disability, the demographic groups most similar to Yaqui are Marshallese (12.9%, a difference of 0.24%), English (12.8%, a difference of 0.29%), White/Caucasian (12.8%, a difference of 0.34%), Pima (12.8%, a difference of 0.44%), and Immigrants from Cabo Verde (12.8%, a difference of 0.59%). Similarly, the demographic groups most similar to Fijians are African (12.6%, a difference of 0.050%), Hopi (12.5%, a difference of 0.35%), Finnish (12.6%, a difference of 0.37%), Central American Indian (12.7%, a difference of 0.87%), and Slovak (12.7%, a difference of 1.0%).
| Demographics | Rating | Rank | Male Disability |
| Hopi | 0.0 /100 | #274 | Tragic 12.5% |
| Fijians | 0.0 /100 | #275 | Tragic 12.6% |
| Africans | 0.0 /100 | #276 | Tragic 12.6% |
| Finns | 0.0 /100 | #277 | Tragic 12.6% |
| Central American Indians | 0.0 /100 | #278 | Tragic 12.7% |
| Slovaks | 0.0 /100 | #279 | Tragic 12.7% |
| Dutch | 0.0 /100 | #280 | Tragic 12.7% |
| Sioux | 0.0 /100 | #281 | Tragic 12.7% |
| Irish | 0.0 /100 | #282 | Tragic 12.7% |
| Germans | 0.0 /100 | #283 | Tragic 12.7% |
| Spanish | 0.0 /100 | #284 | Tragic 12.7% |
| Welsh | 0.0 /100 | #285 | Tragic 12.7% |
| Scottish | 0.0 /100 | #286 | Tragic 12.8% |
| Cape Verdeans | 0.0 /100 | #287 | Tragic 12.8% |
| Yup'ik | 0.0 /100 | #288 | Tragic 12.8% |
| Immigrants | Cabo Verde | 0.0 /100 | #289 | Tragic 12.8% |
| Pima | 0.0 /100 | #290 | Tragic 12.8% |
| Whites/Caucasians | 0.0 /100 | #291 | Tragic 12.8% |
| English | 0.0 /100 | #292 | Tragic 12.8% |
| Yaqui | 0.0 /100 | #293 | Tragic 12.9% |
| Marshallese | 0.0 /100 | #294 | Tragic 12.9% |