Scotch-Irish vs Fijian Male Disability
COMPARE
Scotch-Irish
Fijian
Male Disability
Male Disability Comparison
Scotch-Irish
Fijians
13.2%
MALE DISABILITY
0.0/ 100
METRIC RATING
303rd/ 347
METRIC RANK
12.6%
MALE DISABILITY
0.0/ 100
METRIC RATING
275th/ 347
METRIC RANK
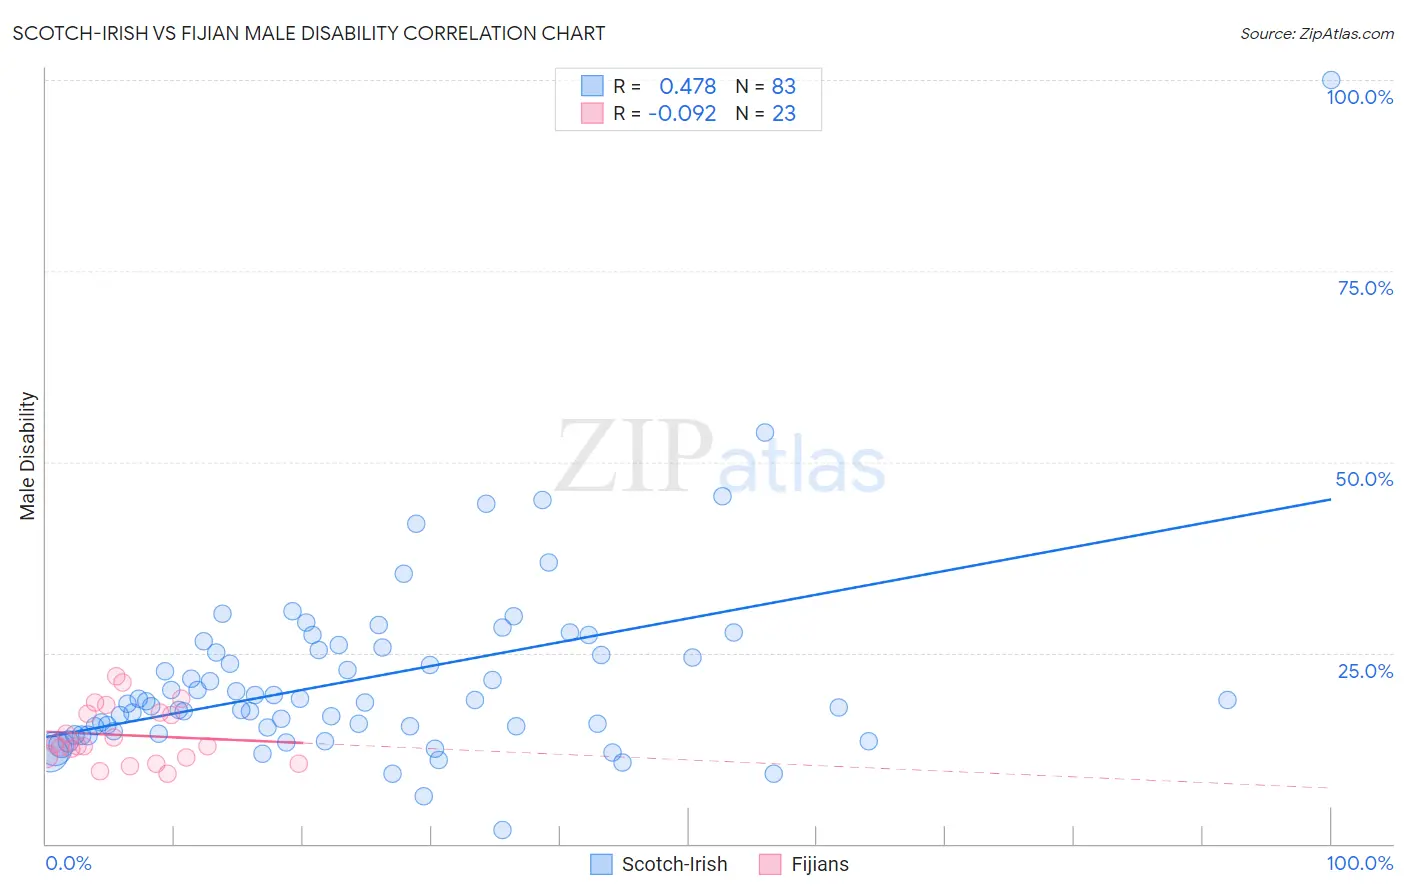
Scotch-Irish vs Fijian Male Disability Correlation Chart
The statistical analysis conducted on geographies consisting of 548,574,277 people shows a moderate positive correlation between the proportion of Scotch-Irish and percentage of males with a disability in the United States with a correlation coefficient (R) of 0.478 and weighted average of 13.2%. Similarly, the statistical analysis conducted on geographies consisting of 55,947,896 people shows a slight negative correlation between the proportion of Fijians and percentage of males with a disability in the United States with a correlation coefficient (R) of -0.092 and weighted average of 12.6%, a difference of 5.0%.
Male Disability Correlation Summary
| Measurement | Scotch-Irish | Fijian |
| Minimum | 1.8% | 9.2% |
| Maximum | 100.0% | 22.0% |
| Range | 98.2% | 12.7% |
| Mean | 21.6% | 14.2% |
| Median | 18.6% | 12.8% |
| Interquartile 25% (IQ1) | 14.8% | 11.2% |
| Interquartile 75% (IQ3) | 25.6% | 17.3% |
| Interquartile Range (IQR) | 10.9% | 6.0% |
| Standard Deviation (Sample) | 12.6% | 3.8% |
| Standard Deviation (Population) | 12.6% | 3.7% |
Similar Demographics by Male Disability
Demographics Similar to Scotch-Irish by Male Disability
In terms of male disability, the demographic groups most similar to Scotch-Irish are Black/African American (13.2%, a difference of 0.32%), Crow (13.1%, a difference of 0.54%), French Canadian (13.3%, a difference of 0.74%), Spanish American (13.3%, a difference of 0.94%), and French (13.0%, a difference of 1.1%).
| Demographics | Rating | Rank | Male Disability |
| Immigrants | Nonimmigrants | 0.0 /100 | #296 | Tragic 12.9% |
| Inupiat | 0.0 /100 | #297 | Tragic 13.0% |
| Pennsylvania Germans | 0.0 /100 | #298 | Tragic 13.0% |
| Celtics | 0.0 /100 | #299 | Tragic 13.0% |
| Cheyenne | 0.0 /100 | #300 | Tragic 13.0% |
| French | 0.0 /100 | #301 | Tragic 13.0% |
| Crow | 0.0 /100 | #302 | Tragic 13.1% |
| Scotch-Irish | 0.0 /100 | #303 | Tragic 13.2% |
| Blacks/African Americans | 0.0 /100 | #304 | Tragic 13.2% |
| French Canadians | 0.0 /100 | #305 | Tragic 13.3% |
| Spanish Americans | 0.0 /100 | #306 | Tragic 13.3% |
| Arapaho | 0.0 /100 | #307 | Tragic 13.3% |
| French American Indians | 0.0 /100 | #308 | Tragic 13.4% |
| Blackfeet | 0.0 /100 | #309 | Tragic 13.4% |
| Immigrants | Azores | 0.0 /100 | #310 | Tragic 13.4% |
Demographics Similar to Fijians by Male Disability
In terms of male disability, the demographic groups most similar to Fijians are African (12.6%, a difference of 0.050%), Hopi (12.5%, a difference of 0.35%), Finnish (12.6%, a difference of 0.37%), Native Hawaiian (12.5%, a difference of 0.68%), and Hmong (12.5%, a difference of 0.75%).
| Demographics | Rating | Rank | Male Disability |
| Portuguese | 0.1 /100 | #268 | Tragic 12.3% |
| Czechoslovakians | 0.1 /100 | #269 | Tragic 12.3% |
| Spaniards | 0.1 /100 | #270 | Tragic 12.3% |
| Scandinavians | 0.1 /100 | #271 | Tragic 12.3% |
| Hmong | 0.0 /100 | #272 | Tragic 12.5% |
| Native Hawaiians | 0.0 /100 | #273 | Tragic 12.5% |
| Hopi | 0.0 /100 | #274 | Tragic 12.5% |
| Fijians | 0.0 /100 | #275 | Tragic 12.6% |
| Africans | 0.0 /100 | #276 | Tragic 12.6% |
| Finns | 0.0 /100 | #277 | Tragic 12.6% |
| Central American Indians | 0.0 /100 | #278 | Tragic 12.7% |
| Slovaks | 0.0 /100 | #279 | Tragic 12.7% |
| Dutch | 0.0 /100 | #280 | Tragic 12.7% |
| Sioux | 0.0 /100 | #281 | Tragic 12.7% |
| Irish | 0.0 /100 | #282 | Tragic 12.7% |