Yaqui vs Vietnamese Male Disability
COMPARE
Yaqui
Vietnamese
Male Disability
Male Disability Comparison
Yaqui
Vietnamese
12.9%
MALE DISABILITY
0.0/ 100
METRIC RATING
293rd/ 347
METRIC RANK
10.1%
MALE DISABILITY
99.9/ 100
METRIC RATING
28th/ 347
METRIC RANK
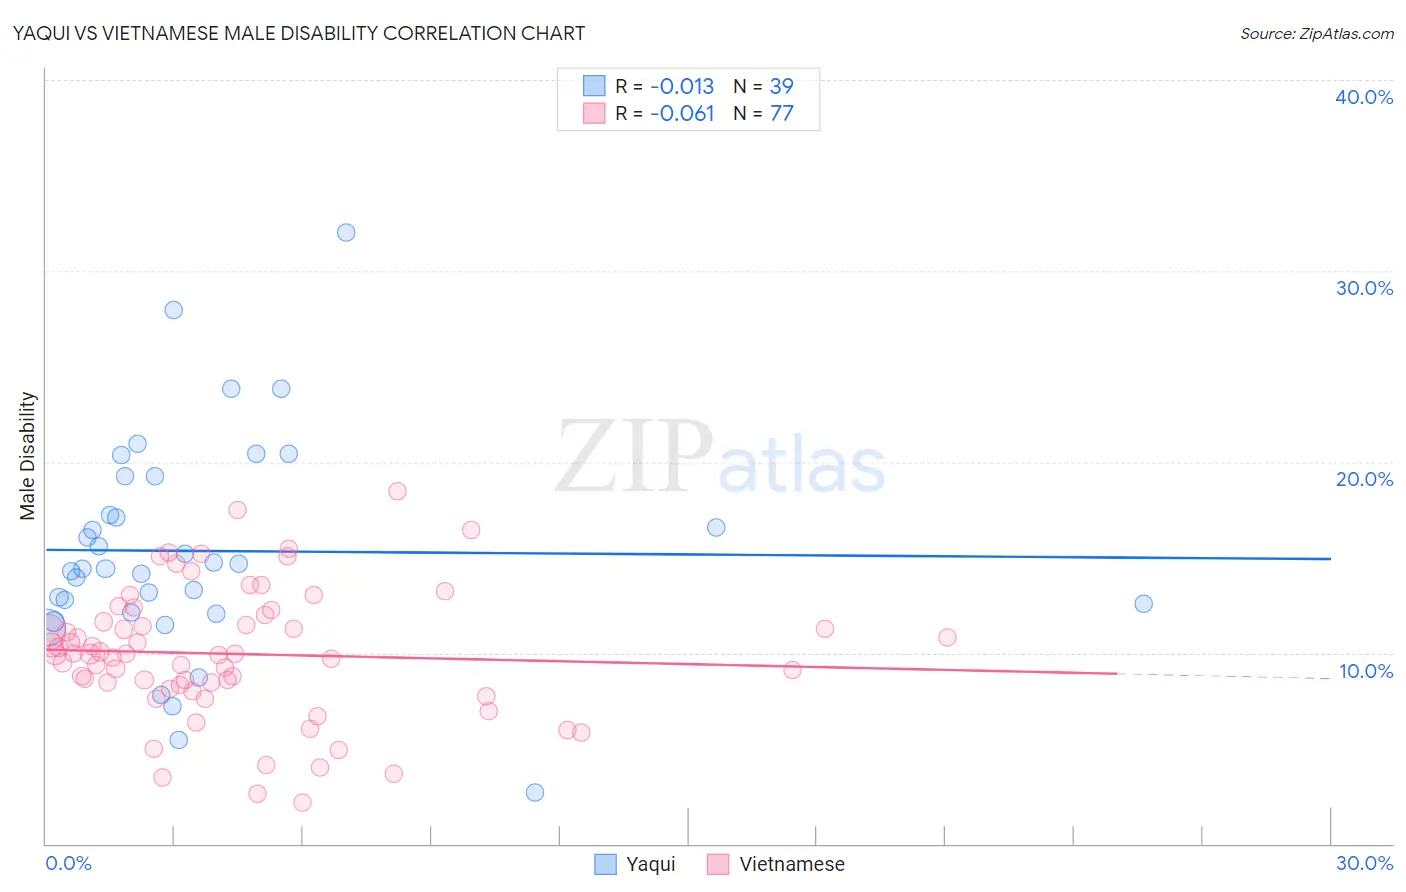
Yaqui vs Vietnamese Male Disability Correlation Chart
The statistical analysis conducted on geographies consisting of 107,718,967 people shows no correlation between the proportion of Yaqui and percentage of males with a disability in the United States with a correlation coefficient (R) of -0.013 and weighted average of 12.9%. Similarly, the statistical analysis conducted on geographies consisting of 170,755,013 people shows a slight negative correlation between the proportion of Vietnamese and percentage of males with a disability in the United States with a correlation coefficient (R) of -0.061 and weighted average of 10.1%, a difference of 27.7%.
Male Disability Correlation Summary
| Measurement | Yaqui | Vietnamese |
| Minimum | 2.7% | 2.1% |
| Maximum | 32.0% | 18.4% |
| Range | 29.3% | 16.3% |
| Mean | 15.3% | 9.9% |
| Median | 14.4% | 9.9% |
| Interquartile 25% (IQ1) | 12.1% | 8.2% |
| Interquartile 75% (IQ3) | 19.2% | 11.8% |
| Interquartile Range (IQR) | 7.1% | 3.6% |
| Standard Deviation (Sample) | 5.8% | 3.4% |
| Standard Deviation (Population) | 5.7% | 3.4% |
Similar Demographics by Male Disability
Demographics Similar to Yaqui by Male Disability
In terms of male disability, the demographic groups most similar to Yaqui are Marshallese (12.9%, a difference of 0.24%), English (12.8%, a difference of 0.29%), Immigrants from Micronesia (12.9%, a difference of 0.33%), White/Caucasian (12.8%, a difference of 0.34%), and Nonimmigrants (12.9%, a difference of 0.40%).
| Demographics | Rating | Rank | Male Disability |
| Scottish | 0.0 /100 | #286 | Tragic 12.8% |
| Cape Verdeans | 0.0 /100 | #287 | Tragic 12.8% |
| Yup'ik | 0.0 /100 | #288 | Tragic 12.8% |
| Immigrants | Cabo Verde | 0.0 /100 | #289 | Tragic 12.8% |
| Pima | 0.0 /100 | #290 | Tragic 12.8% |
| Whites/Caucasians | 0.0 /100 | #291 | Tragic 12.8% |
| English | 0.0 /100 | #292 | Tragic 12.8% |
| Yaqui | 0.0 /100 | #293 | Tragic 12.9% |
| Marshallese | 0.0 /100 | #294 | Tragic 12.9% |
| Immigrants | Micronesia | 0.0 /100 | #295 | Tragic 12.9% |
| Immigrants | Nonimmigrants | 0.0 /100 | #296 | Tragic 12.9% |
| Inupiat | 0.0 /100 | #297 | Tragic 13.0% |
| Pennsylvania Germans | 0.0 /100 | #298 | Tragic 13.0% |
| Celtics | 0.0 /100 | #299 | Tragic 13.0% |
| Cheyenne | 0.0 /100 | #300 | Tragic 13.0% |
Demographics Similar to Vietnamese by Male Disability
In terms of male disability, the demographic groups most similar to Vietnamese are Egyptian (10.1%, a difference of 0.020%), Venezuelan (10.1%, a difference of 0.15%), Immigrants from Egypt (10.1%, a difference of 0.19%), Soviet Union (10.1%, a difference of 0.26%), and Paraguayan (10.1%, a difference of 0.34%).
| Demographics | Rating | Rank | Male Disability |
| Burmese | 100.0 /100 | #21 | Exceptional 10.0% |
| Immigrants | Venezuela | 100.0 /100 | #22 | Exceptional 10.0% |
| Cypriots | 100.0 /100 | #23 | Exceptional 10.0% |
| Immigrants | Asia | 100.0 /100 | #24 | Exceptional 10.0% |
| Immigrants | Malaysia | 99.9 /100 | #25 | Exceptional 10.0% |
| Paraguayans | 99.9 /100 | #26 | Exceptional 10.1% |
| Egyptians | 99.9 /100 | #27 | Exceptional 10.1% |
| Vietnamese | 99.9 /100 | #28 | Exceptional 10.1% |
| Venezuelans | 99.9 /100 | #29 | Exceptional 10.1% |
| Immigrants | Egypt | 99.9 /100 | #30 | Exceptional 10.1% |
| Soviet Union | 99.9 /100 | #31 | Exceptional 10.1% |
| Argentineans | 99.9 /100 | #32 | Exceptional 10.1% |
| Immigrants | Ethiopia | 99.9 /100 | #33 | Exceptional 10.2% |
| Immigrants | Turkey | 99.9 /100 | #34 | Exceptional 10.2% |
| Immigrants | Argentina | 99.9 /100 | #35 | Exceptional 10.2% |