Yaqui vs Hopi Male Disability
COMPARE
Yaqui
Hopi
Male Disability
Male Disability Comparison
Yaqui
Hopi
12.9%
MALE DISABILITY
0.0/ 100
METRIC RATING
293rd/ 347
METRIC RANK
12.5%
MALE DISABILITY
0.0/ 100
METRIC RATING
274th/ 347
METRIC RANK
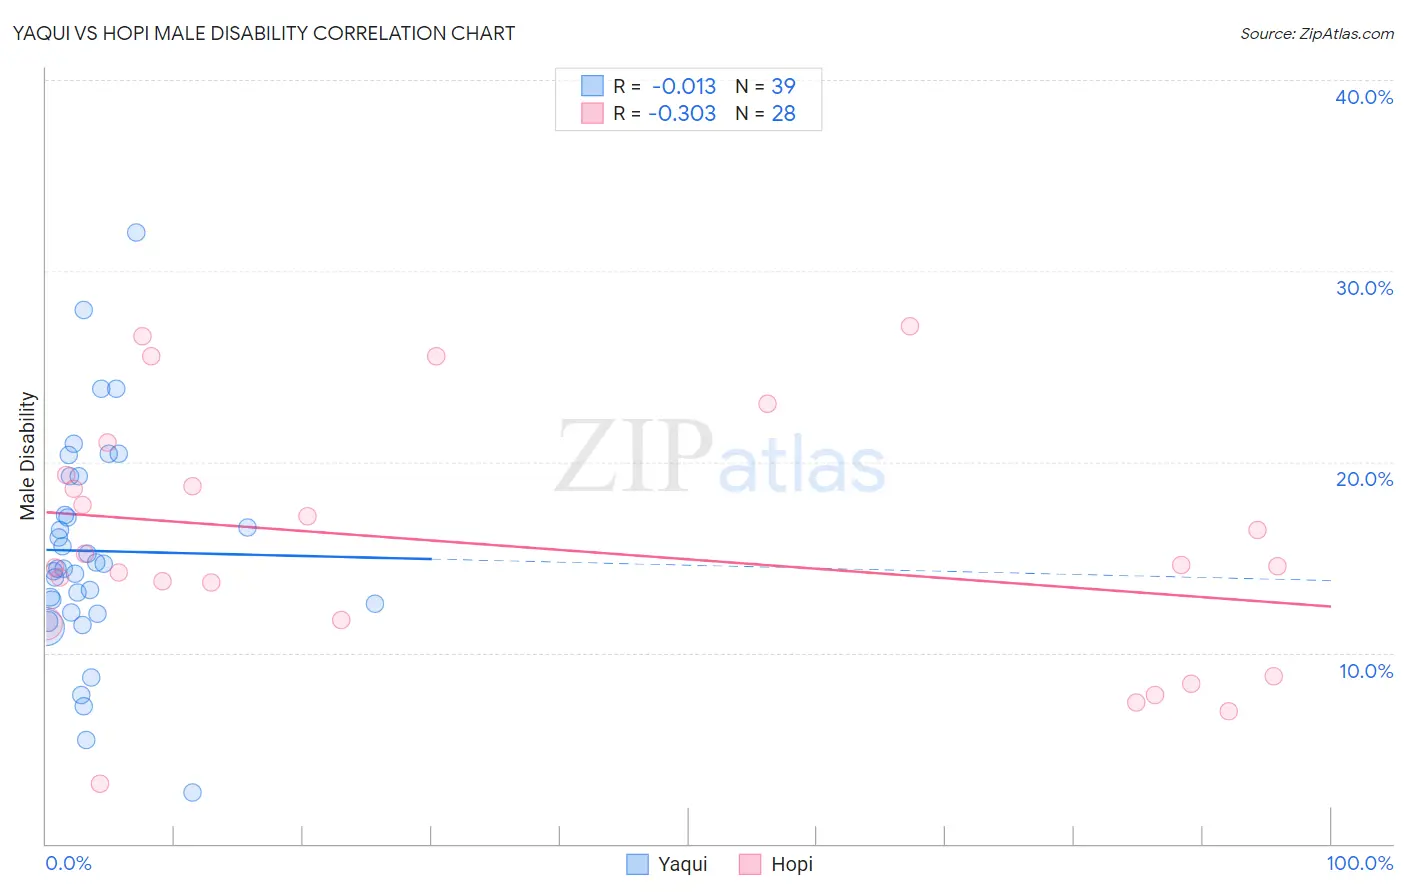
Yaqui vs Hopi Male Disability Correlation Chart
The statistical analysis conducted on geographies consisting of 107,718,967 people shows no correlation between the proportion of Yaqui and percentage of males with a disability in the United States with a correlation coefficient (R) of -0.013 and weighted average of 12.9%. Similarly, the statistical analysis conducted on geographies consisting of 74,731,740 people shows a mild negative correlation between the proportion of Hopi and percentage of males with a disability in the United States with a correlation coefficient (R) of -0.303 and weighted average of 12.5%, a difference of 2.9%.
Male Disability Correlation Summary
| Measurement | Yaqui | Hopi |
| Minimum | 2.7% | 3.2% |
| Maximum | 32.0% | 27.1% |
| Range | 29.3% | 24.0% |
| Mean | 15.3% | 15.6% |
| Median | 14.4% | 14.5% |
| Interquartile 25% (IQ1) | 12.1% | 11.6% |
| Interquartile 75% (IQ3) | 19.2% | 19.0% |
| Interquartile Range (IQR) | 7.1% | 7.4% |
| Standard Deviation (Sample) | 5.8% | 6.3% |
| Standard Deviation (Population) | 5.7% | 6.2% |
Demographics Similar to Yaqui and Hopi by Male Disability
In terms of male disability, the demographic groups most similar to Yaqui are English (12.8%, a difference of 0.29%), White/Caucasian (12.8%, a difference of 0.34%), Pima (12.8%, a difference of 0.44%), Immigrants from Cabo Verde (12.8%, a difference of 0.59%), and Yup'ik (12.8%, a difference of 0.78%). Similarly, the demographic groups most similar to Hopi are Native Hawaiian (12.5%, a difference of 0.33%), Fijian (12.6%, a difference of 0.35%), African (12.6%, a difference of 0.40%), Finnish (12.6%, a difference of 0.72%), and Central American Indian (12.7%, a difference of 1.2%).
| Demographics | Rating | Rank | Male Disability |
| Native Hawaiians | 0.0 /100 | #273 | Tragic 12.5% |
| Hopi | 0.0 /100 | #274 | Tragic 12.5% |
| Fijians | 0.0 /100 | #275 | Tragic 12.6% |
| Africans | 0.0 /100 | #276 | Tragic 12.6% |
| Finns | 0.0 /100 | #277 | Tragic 12.6% |
| Central American Indians | 0.0 /100 | #278 | Tragic 12.7% |
| Slovaks | 0.0 /100 | #279 | Tragic 12.7% |
| Dutch | 0.0 /100 | #280 | Tragic 12.7% |
| Sioux | 0.0 /100 | #281 | Tragic 12.7% |
| Irish | 0.0 /100 | #282 | Tragic 12.7% |
| Germans | 0.0 /100 | #283 | Tragic 12.7% |
| Spanish | 0.0 /100 | #284 | Tragic 12.7% |
| Welsh | 0.0 /100 | #285 | Tragic 12.7% |
| Scottish | 0.0 /100 | #286 | Tragic 12.8% |
| Cape Verdeans | 0.0 /100 | #287 | Tragic 12.8% |
| Yup'ik | 0.0 /100 | #288 | Tragic 12.8% |
| Immigrants | Cabo Verde | 0.0 /100 | #289 | Tragic 12.8% |
| Pima | 0.0 /100 | #290 | Tragic 12.8% |
| Whites/Caucasians | 0.0 /100 | #291 | Tragic 12.8% |
| English | 0.0 /100 | #292 | Tragic 12.8% |
| Yaqui | 0.0 /100 | #293 | Tragic 12.9% |