Immigrants from Panama vs Fijian Male Disability
COMPARE
Immigrants from Panama
Fijian
Male Disability
Male Disability Comparison
Immigrants from Panama
Fijians
11.5%
MALE DISABILITY
13.0/ 100
METRIC RATING
201st/ 347
METRIC RANK
12.6%
MALE DISABILITY
0.0/ 100
METRIC RATING
275th/ 347
METRIC RANK
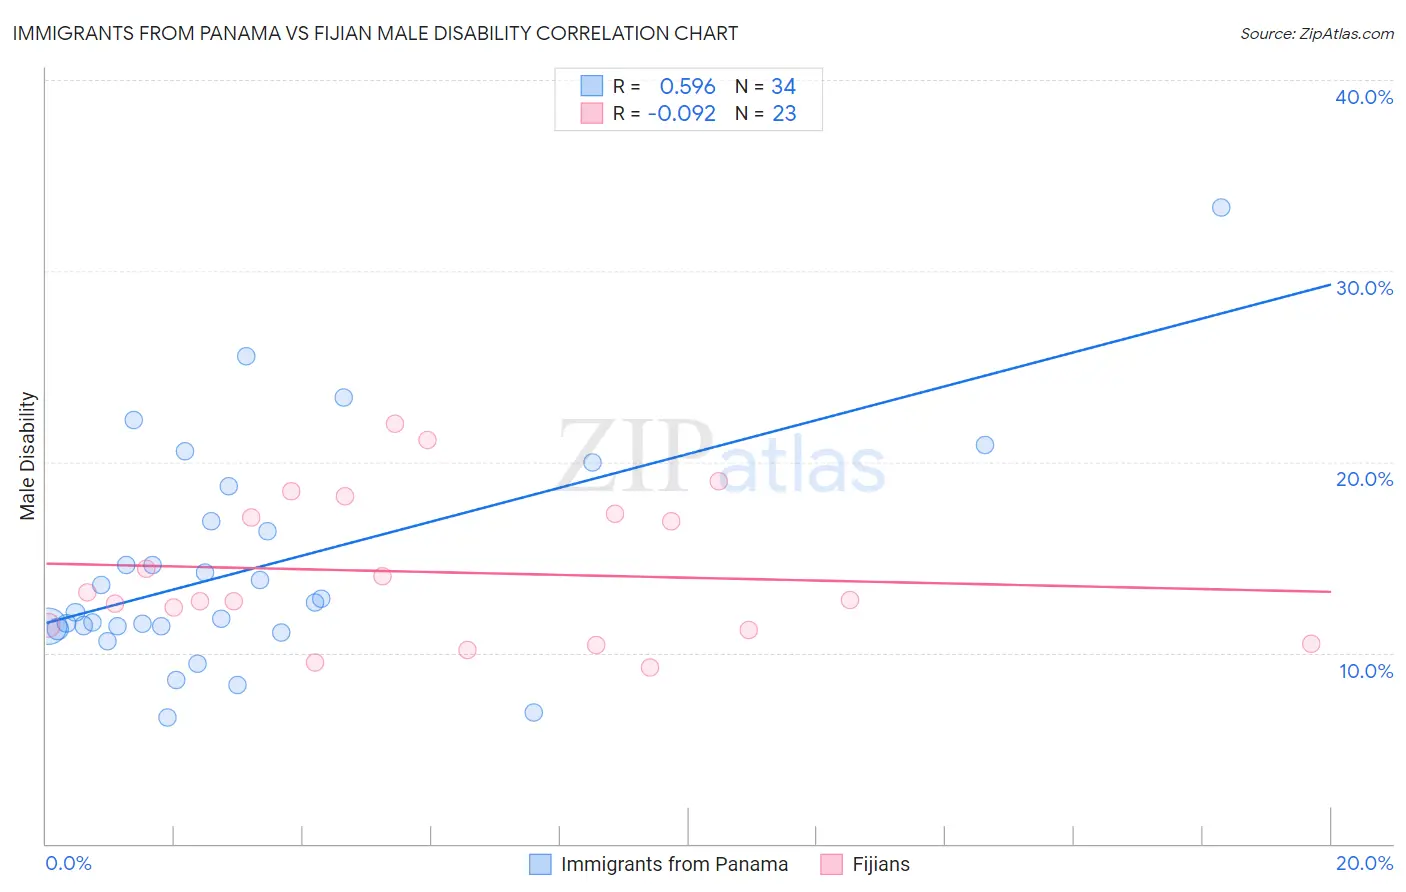
Immigrants from Panama vs Fijian Male Disability Correlation Chart
The statistical analysis conducted on geographies consisting of 221,177,932 people shows a substantial positive correlation between the proportion of Immigrants from Panama and percentage of males with a disability in the United States with a correlation coefficient (R) of 0.596 and weighted average of 11.5%. Similarly, the statistical analysis conducted on geographies consisting of 55,947,896 people shows a slight negative correlation between the proportion of Fijians and percentage of males with a disability in the United States with a correlation coefficient (R) of -0.092 and weighted average of 12.6%, a difference of 9.1%.
Male Disability Correlation Summary
| Measurement | Immigrants from Panama | Fijian |
| Minimum | 6.6% | 9.2% |
| Maximum | 33.3% | 22.0% |
| Range | 26.7% | 12.7% |
| Mean | 14.4% | 14.2% |
| Median | 12.4% | 12.8% |
| Interquartile 25% (IQ1) | 11.4% | 11.2% |
| Interquartile 75% (IQ3) | 16.9% | 17.3% |
| Interquartile Range (IQR) | 5.5% | 6.0% |
| Standard Deviation (Sample) | 5.7% | 3.8% |
| Standard Deviation (Population) | 5.7% | 3.7% |
Similar Demographics by Male Disability
Demographics Similar to Immigrants from Panama by Male Disability
In terms of male disability, the demographic groups most similar to Immigrants from Panama are Immigrants from Iraq (11.5%, a difference of 0.0%), Immigrants from Mexico (11.5%, a difference of 0.040%), Lebanese (11.5%, a difference of 0.27%), Jamaican (11.5%, a difference of 0.27%), and Immigrants from Cambodia (11.5%, a difference of 0.29%).
| Demographics | Rating | Rank | Male Disability |
| Belizeans | 21.2 /100 | #194 | Fair 11.4% |
| Immigrants | Oceania | 20.9 /100 | #195 | Fair 11.4% |
| West Indians | 18.4 /100 | #196 | Poor 11.4% |
| Somalis | 18.2 /100 | #197 | Poor 11.4% |
| Immigrants | Jamaica | 16.3 /100 | #198 | Poor 11.5% |
| Lebanese | 15.4 /100 | #199 | Poor 11.5% |
| Immigrants | Iraq | 13.0 /100 | #200 | Poor 11.5% |
| Immigrants | Panama | 13.0 /100 | #201 | Poor 11.5% |
| Immigrants | Mexico | 12.6 /100 | #202 | Poor 11.5% |
| Jamaicans | 10.9 /100 | #203 | Poor 11.5% |
| Immigrants | Cambodia | 10.8 /100 | #204 | Poor 11.5% |
| Serbians | 10.7 /100 | #205 | Poor 11.5% |
| Ukrainians | 10.6 /100 | #206 | Poor 11.5% |
| Immigrants | Somalia | 10.4 /100 | #207 | Poor 11.5% |
| Icelanders | 10.1 /100 | #208 | Poor 11.6% |
Demographics Similar to Fijians by Male Disability
In terms of male disability, the demographic groups most similar to Fijians are African (12.6%, a difference of 0.050%), Hopi (12.5%, a difference of 0.35%), Finnish (12.6%, a difference of 0.37%), Native Hawaiian (12.5%, a difference of 0.68%), and Hmong (12.5%, a difference of 0.75%).
| Demographics | Rating | Rank | Male Disability |
| Portuguese | 0.1 /100 | #268 | Tragic 12.3% |
| Czechoslovakians | 0.1 /100 | #269 | Tragic 12.3% |
| Spaniards | 0.1 /100 | #270 | Tragic 12.3% |
| Scandinavians | 0.1 /100 | #271 | Tragic 12.3% |
| Hmong | 0.0 /100 | #272 | Tragic 12.5% |
| Native Hawaiians | 0.0 /100 | #273 | Tragic 12.5% |
| Hopi | 0.0 /100 | #274 | Tragic 12.5% |
| Fijians | 0.0 /100 | #275 | Tragic 12.6% |
| Africans | 0.0 /100 | #276 | Tragic 12.6% |
| Finns | 0.0 /100 | #277 | Tragic 12.6% |
| Central American Indians | 0.0 /100 | #278 | Tragic 12.7% |
| Slovaks | 0.0 /100 | #279 | Tragic 12.7% |
| Dutch | 0.0 /100 | #280 | Tragic 12.7% |
| Sioux | 0.0 /100 | #281 | Tragic 12.7% |
| Irish | 0.0 /100 | #282 | Tragic 12.7% |