Tsimshian vs Fijian Male Disability
COMPARE
Tsimshian
Fijian
Male Disability
Male Disability Comparison
Tsimshian
Fijians
15.6%
MALE DISABILITY
0.0/ 100
METRIC RATING
345th/ 347
METRIC RANK
12.6%
MALE DISABILITY
0.0/ 100
METRIC RATING
275th/ 347
METRIC RANK
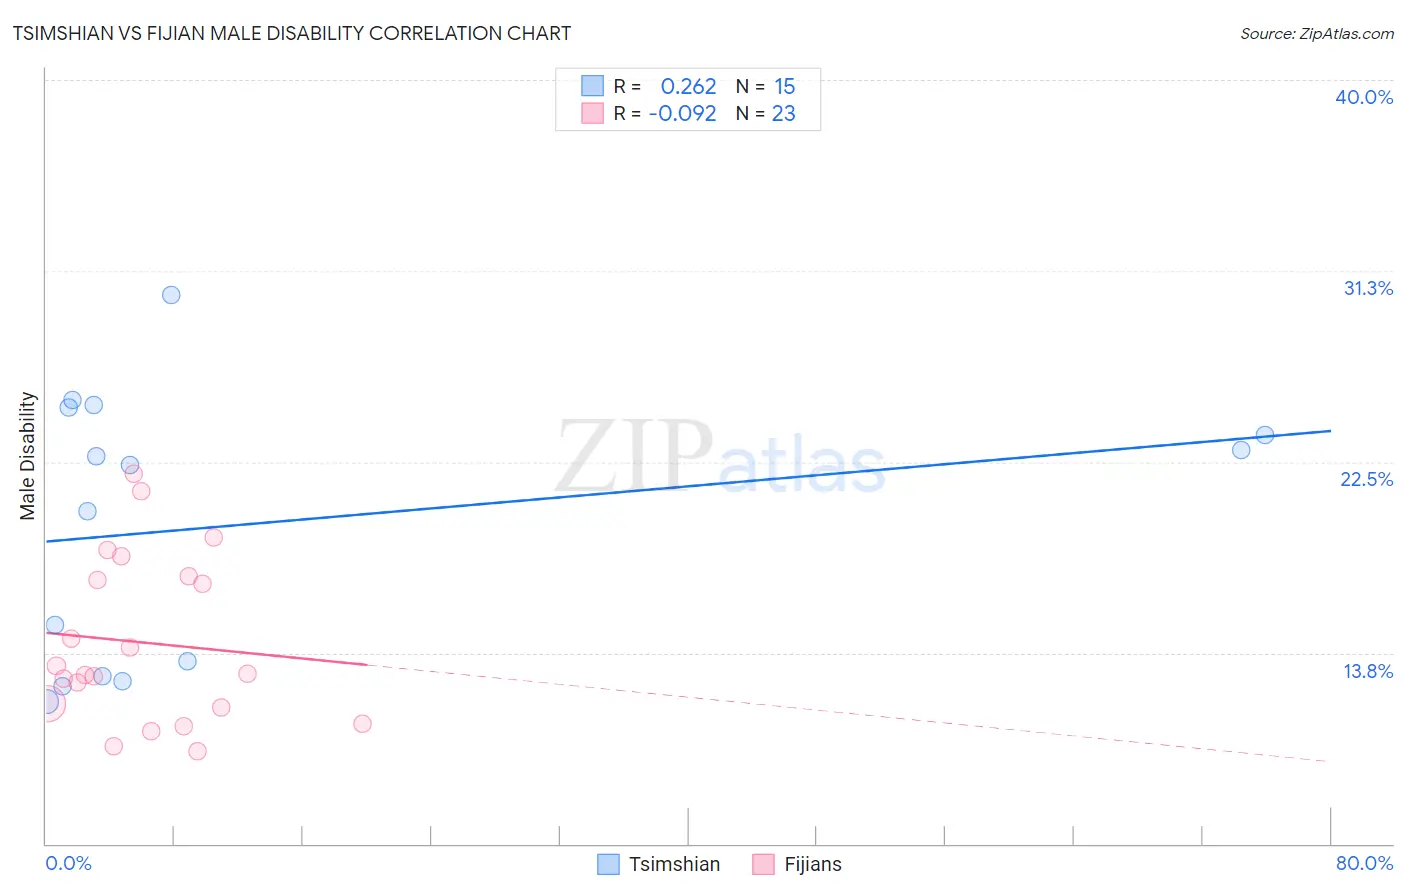
Tsimshian vs Fijian Male Disability Correlation Chart
The statistical analysis conducted on geographies consisting of 15,626,544 people shows a weak positive correlation between the proportion of Tsimshian and percentage of males with a disability in the United States with a correlation coefficient (R) of 0.262 and weighted average of 15.6%. Similarly, the statistical analysis conducted on geographies consisting of 55,947,896 people shows a slight negative correlation between the proportion of Fijians and percentage of males with a disability in the United States with a correlation coefficient (R) of -0.092 and weighted average of 12.6%, a difference of 24.2%.
Male Disability Correlation Summary
| Measurement | Tsimshian | Fijian |
| Minimum | 11.5% | 9.2% |
| Maximum | 30.2% | 22.0% |
| Range | 18.6% | 12.7% |
| Mean | 19.7% | 14.2% |
| Median | 22.4% | 12.8% |
| Interquartile 25% (IQ1) | 12.7% | 11.2% |
| Interquartile 75% (IQ3) | 25.0% | 17.3% |
| Interquartile Range (IQR) | 12.3% | 6.0% |
| Standard Deviation (Sample) | 6.1% | 3.8% |
| Standard Deviation (Population) | 5.9% | 3.7% |
Similar Demographics by Male Disability
Demographics Similar to Tsimshian by Male Disability
In terms of male disability, the demographic groups most similar to Tsimshian are Puerto Rican (15.6%, a difference of 0.32%), Creek (15.5%, a difference of 0.45%), Kiowa (15.4%, a difference of 1.1%), Choctaw (15.4%, a difference of 1.3%), and Lumbee (15.2%, a difference of 2.4%).
| Demographics | Rating | Rank | Male Disability |
| Yuman | 0.0 /100 | #333 | Tragic 14.7% |
| Cherokee | 0.0 /100 | #334 | Tragic 14.8% |
| Dutch West Indians | 0.0 /100 | #335 | Tragic 14.8% |
| Alaskan Athabascans | 0.0 /100 | #336 | Tragic 14.9% |
| Menominee | 0.0 /100 | #337 | Tragic 15.0% |
| Pueblo | 0.0 /100 | #338 | Tragic 15.0% |
| Chickasaw | 0.0 /100 | #339 | Tragic 15.1% |
| Lumbee | 0.0 /100 | #340 | Tragic 15.2% |
| Choctaw | 0.0 /100 | #341 | Tragic 15.4% |
| Kiowa | 0.0 /100 | #342 | Tragic 15.4% |
| Creek | 0.0 /100 | #343 | Tragic 15.5% |
| Puerto Ricans | 0.0 /100 | #344 | Tragic 15.6% |
| Tsimshian | 0.0 /100 | #345 | Tragic 15.6% |
| Colville | 0.0 /100 | #346 | Tragic 16.5% |
| Houma | 0.0 /100 | #347 | Tragic 17.4% |
Demographics Similar to Fijians by Male Disability
In terms of male disability, the demographic groups most similar to Fijians are African (12.6%, a difference of 0.050%), Hopi (12.5%, a difference of 0.35%), Finnish (12.6%, a difference of 0.37%), Native Hawaiian (12.5%, a difference of 0.68%), and Hmong (12.5%, a difference of 0.75%).
| Demographics | Rating | Rank | Male Disability |
| Portuguese | 0.1 /100 | #268 | Tragic 12.3% |
| Czechoslovakians | 0.1 /100 | #269 | Tragic 12.3% |
| Spaniards | 0.1 /100 | #270 | Tragic 12.3% |
| Scandinavians | 0.1 /100 | #271 | Tragic 12.3% |
| Hmong | 0.0 /100 | #272 | Tragic 12.5% |
| Native Hawaiians | 0.0 /100 | #273 | Tragic 12.5% |
| Hopi | 0.0 /100 | #274 | Tragic 12.5% |
| Fijians | 0.0 /100 | #275 | Tragic 12.6% |
| Africans | 0.0 /100 | #276 | Tragic 12.6% |
| Finns | 0.0 /100 | #277 | Tragic 12.6% |
| Central American Indians | 0.0 /100 | #278 | Tragic 12.7% |
| Slovaks | 0.0 /100 | #279 | Tragic 12.7% |
| Dutch | 0.0 /100 | #280 | Tragic 12.7% |
| Sioux | 0.0 /100 | #281 | Tragic 12.7% |
| Irish | 0.0 /100 | #282 | Tragic 12.7% |