Yaqui vs Slovak Male Disability
COMPARE
Yaqui
Slovak
Male Disability
Male Disability Comparison
Yaqui
Slovaks
12.9%
MALE DISABILITY
0.0/ 100
METRIC RATING
293rd/ 347
METRIC RANK
12.7%
MALE DISABILITY
0.0/ 100
METRIC RATING
279th/ 347
METRIC RANK
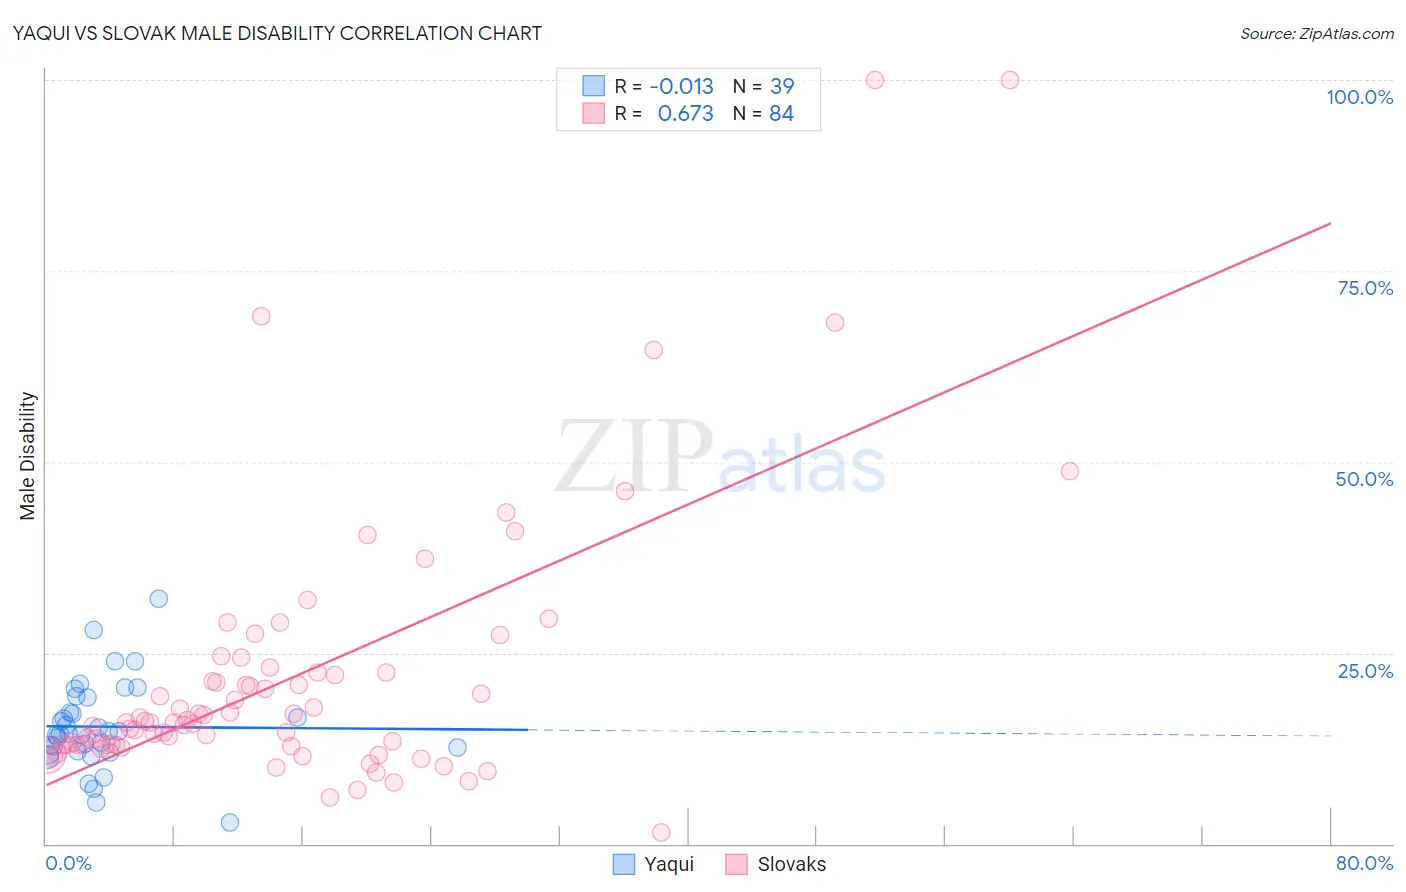
Yaqui vs Slovak Male Disability Correlation Chart
The statistical analysis conducted on geographies consisting of 107,718,967 people shows no correlation between the proportion of Yaqui and percentage of males with a disability in the United States with a correlation coefficient (R) of -0.013 and weighted average of 12.9%. Similarly, the statistical analysis conducted on geographies consisting of 397,843,649 people shows a significant positive correlation between the proportion of Slovaks and percentage of males with a disability in the United States with a correlation coefficient (R) of 0.673 and weighted average of 12.7%, a difference of 1.5%.
Male Disability Correlation Summary
| Measurement | Yaqui | Slovak |
| Minimum | 2.7% | 1.5% |
| Maximum | 32.0% | 100.0% |
| Range | 29.3% | 98.5% |
| Mean | 15.3% | 21.9% |
| Median | 14.4% | 15.9% |
| Interquartile 25% (IQ1) | 12.1% | 12.9% |
| Interquartile 75% (IQ3) | 19.2% | 22.4% |
| Interquartile Range (IQR) | 7.1% | 9.5% |
| Standard Deviation (Sample) | 5.8% | 17.7% |
| Standard Deviation (Population) | 5.7% | 17.6% |
Demographics Similar to Yaqui and Slovaks by Male Disability
In terms of male disability, the demographic groups most similar to Yaqui are Marshallese (12.9%, a difference of 0.24%), English (12.8%, a difference of 0.29%), Immigrants from Micronesia (12.9%, a difference of 0.33%), White/Caucasian (12.8%, a difference of 0.34%), and Nonimmigrants (12.9%, a difference of 0.40%). Similarly, the demographic groups most similar to Slovaks are Dutch (12.7%, a difference of 0.050%), Sioux (12.7%, a difference of 0.11%), Central American Indian (12.7%, a difference of 0.15%), Irish (12.7%, a difference of 0.16%), and German (12.7%, a difference of 0.17%).
| Demographics | Rating | Rank | Male Disability |
| Africans | 0.0 /100 | #276 | Tragic 12.6% |
| Finns | 0.0 /100 | #277 | Tragic 12.6% |
| Central American Indians | 0.0 /100 | #278 | Tragic 12.7% |
| Slovaks | 0.0 /100 | #279 | Tragic 12.7% |
| Dutch | 0.0 /100 | #280 | Tragic 12.7% |
| Sioux | 0.0 /100 | #281 | Tragic 12.7% |
| Irish | 0.0 /100 | #282 | Tragic 12.7% |
| Germans | 0.0 /100 | #283 | Tragic 12.7% |
| Spanish | 0.0 /100 | #284 | Tragic 12.7% |
| Welsh | 0.0 /100 | #285 | Tragic 12.7% |
| Scottish | 0.0 /100 | #286 | Tragic 12.8% |
| Cape Verdeans | 0.0 /100 | #287 | Tragic 12.8% |
| Yup'ik | 0.0 /100 | #288 | Tragic 12.8% |
| Immigrants | Cabo Verde | 0.0 /100 | #289 | Tragic 12.8% |
| Pima | 0.0 /100 | #290 | Tragic 12.8% |
| Whites/Caucasians | 0.0 /100 | #291 | Tragic 12.8% |
| English | 0.0 /100 | #292 | Tragic 12.8% |
| Yaqui | 0.0 /100 | #293 | Tragic 12.9% |
| Marshallese | 0.0 /100 | #294 | Tragic 12.9% |
| Immigrants | Micronesia | 0.0 /100 | #295 | Tragic 12.9% |
| Immigrants | Nonimmigrants | 0.0 /100 | #296 | Tragic 12.9% |