Yaqui vs Fijian In Labor Force | Age 20-24
COMPARE
Yaqui
Fijian
In Labor Force | Age 20-24
In Labor Force | Age 20-24 Comparison
Yaqui
Fijians
75.5%
IN LABOR FORCE | AGE 20-24
85.5/ 100
METRIC RATING
135th/ 347
METRIC RANK
77.4%
IN LABOR FORCE | AGE 20-24
100.0/ 100
METRIC RATING
44th/ 347
METRIC RANK
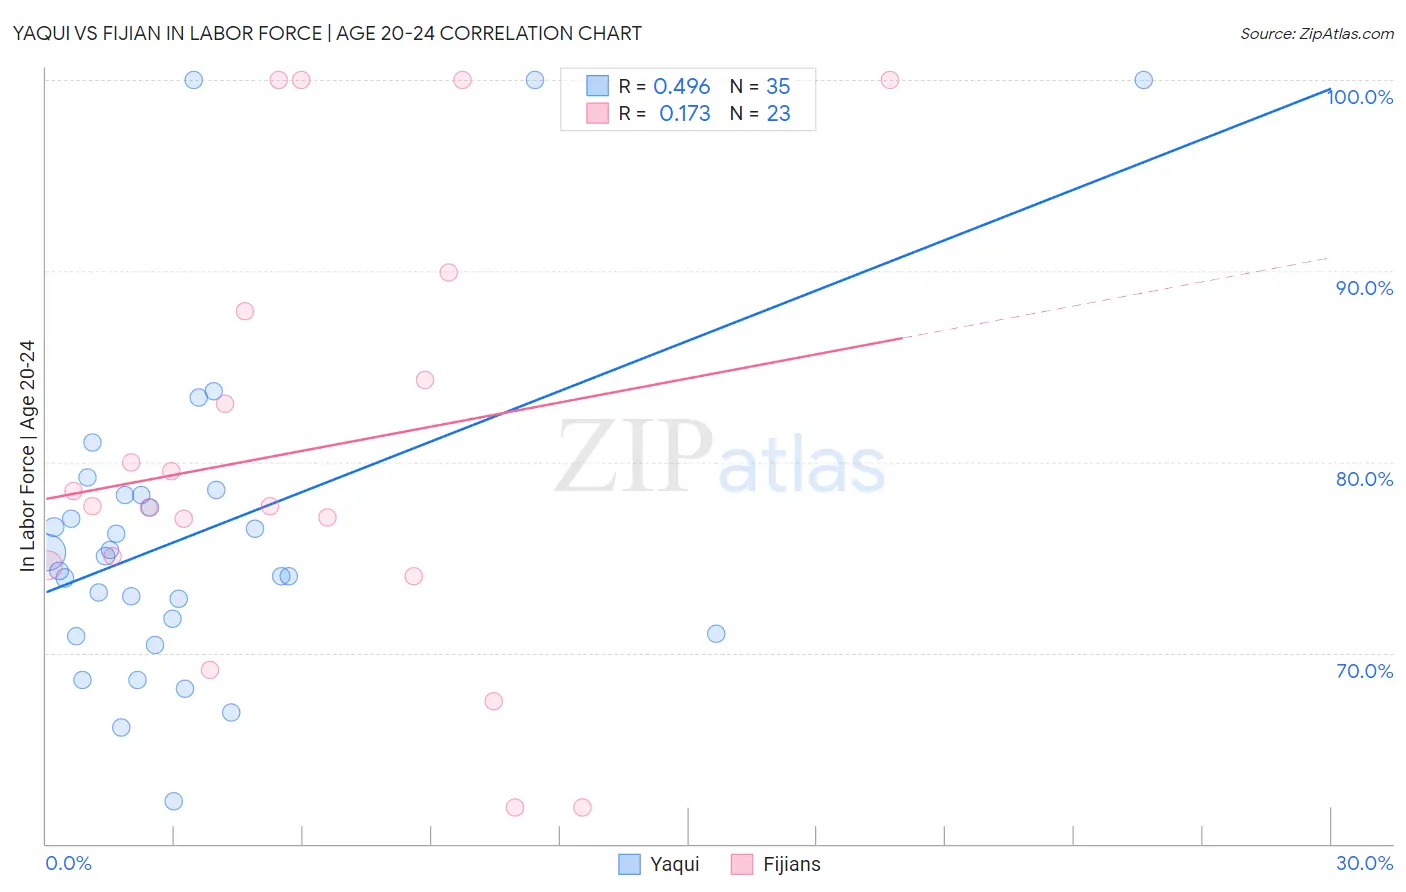
Yaqui vs Fijian In Labor Force | Age 20-24 Correlation Chart
The statistical analysis conducted on geographies consisting of 107,696,934 people shows a moderate positive correlation between the proportion of Yaqui and labor force participation rate among population between the ages 20 and 24 in the United States with a correlation coefficient (R) of 0.496 and weighted average of 75.5%. Similarly, the statistical analysis conducted on geographies consisting of 55,946,131 people shows a poor positive correlation between the proportion of Fijians and labor force participation rate among population between the ages 20 and 24 in the United States with a correlation coefficient (R) of 0.173 and weighted average of 77.4%, a difference of 2.4%.
In Labor Force | Age 20-24 Correlation Summary
| Measurement | Yaqui | Fijian |
| Minimum | 62.2% | 61.9% |
| Maximum | 100.0% | 100.0% |
| Range | 37.8% | 38.1% |
| Mean | 76.3% | 80.6% |
| Median | 75.1% | 77.7% |
| Interquartile 25% (IQ1) | 71.0% | 74.6% |
| Interquartile 75% (IQ3) | 78.3% | 87.9% |
| Interquartile Range (IQR) | 7.3% | 13.3% |
| Standard Deviation (Sample) | 8.7% | 11.4% |
| Standard Deviation (Population) | 8.6% | 11.1% |
Similar Demographics by In Labor Force | Age 20-24
Demographics Similar to Yaqui by In Labor Force | Age 20-24
In terms of in labor force | age 20-24, the demographic groups most similar to Yaqui are Immigrants from Brazil (75.5%, a difference of 0.020%), Jordanian (75.5%, a difference of 0.020%), Australian (75.5%, a difference of 0.020%), Immigrants from England (75.5%, a difference of 0.030%), and Delaware (75.5%, a difference of 0.030%).
| Demographics | Rating | Rank | In Labor Force | Age 20-24 |
| Immigrants | Afghanistan | 89.4 /100 | #128 | Excellent 75.6% |
| Iroquois | 89.1 /100 | #129 | Excellent 75.6% |
| Immigrants | Austria | 88.8 /100 | #130 | Excellent 75.6% |
| Immigrants | Jordan | 88.5 /100 | #131 | Excellent 75.6% |
| Palestinians | 88.4 /100 | #132 | Excellent 75.6% |
| Zimbabweans | 88.2 /100 | #133 | Excellent 75.6% |
| Estonians | 87.1 /100 | #134 | Excellent 75.6% |
| Yaqui | 85.5 /100 | #135 | Excellent 75.5% |
| Immigrants | Brazil | 84.8 /100 | #136 | Excellent 75.5% |
| Jordanians | 84.8 /100 | #137 | Excellent 75.5% |
| Australians | 84.8 /100 | #138 | Excellent 75.5% |
| Immigrants | England | 84.6 /100 | #139 | Excellent 75.5% |
| Delaware | 84.5 /100 | #140 | Excellent 75.5% |
| Romanians | 84.1 /100 | #141 | Excellent 75.5% |
| Blackfeet | 83.6 /100 | #142 | Excellent 75.5% |
Demographics Similar to Fijians by In Labor Force | Age 20-24
In terms of in labor force | age 20-24, the demographic groups most similar to Fijians are Immigrants from Laos (77.4%, a difference of 0.010%), Native Hawaiian (77.4%, a difference of 0.010%), Samoan (77.4%, a difference of 0.010%), French (77.4%, a difference of 0.020%), and Immigrants from Congo (77.4%, a difference of 0.030%).
| Demographics | Rating | Rank | In Labor Force | Age 20-24 |
| Czechoslovakians | 100.0 /100 | #37 | Exceptional 77.5% |
| Marshallese | 100.0 /100 | #38 | Exceptional 77.4% |
| Irish | 100.0 /100 | #39 | Exceptional 77.4% |
| Scottish | 100.0 /100 | #40 | Exceptional 77.4% |
| Immigrants | Congo | 100.0 /100 | #41 | Exceptional 77.4% |
| French | 100.0 /100 | #42 | Exceptional 77.4% |
| Immigrants | Laos | 100.0 /100 | #43 | Exceptional 77.4% |
| Fijians | 100.0 /100 | #44 | Exceptional 77.4% |
| Native Hawaiians | 100.0 /100 | #45 | Exceptional 77.4% |
| Samoans | 100.0 /100 | #46 | Exceptional 77.4% |
| Ethiopians | 100.0 /100 | #47 | Exceptional 77.3% |
| Serbians | 100.0 /100 | #48 | Exceptional 77.3% |
| Chinese | 100.0 /100 | #49 | Exceptional 77.3% |
| Malaysians | 100.0 /100 | #50 | Exceptional 77.2% |
| Croatians | 100.0 /100 | #51 | Exceptional 77.2% |