Yakama vs Immigrants Ambulatory Disability
COMPARE
Yakama
Immigrants
Ambulatory Disability
Ambulatory Disability Comparison
Yakama
Immigrants
6.8%
AMBULATORY DISABILITY
0.0/ 100
METRIC RATING
286th/ 347
METRIC RANK
6.0%
AMBULATORY DISABILITY
86.9/ 100
METRIC RATING
133rd/ 347
METRIC RANK
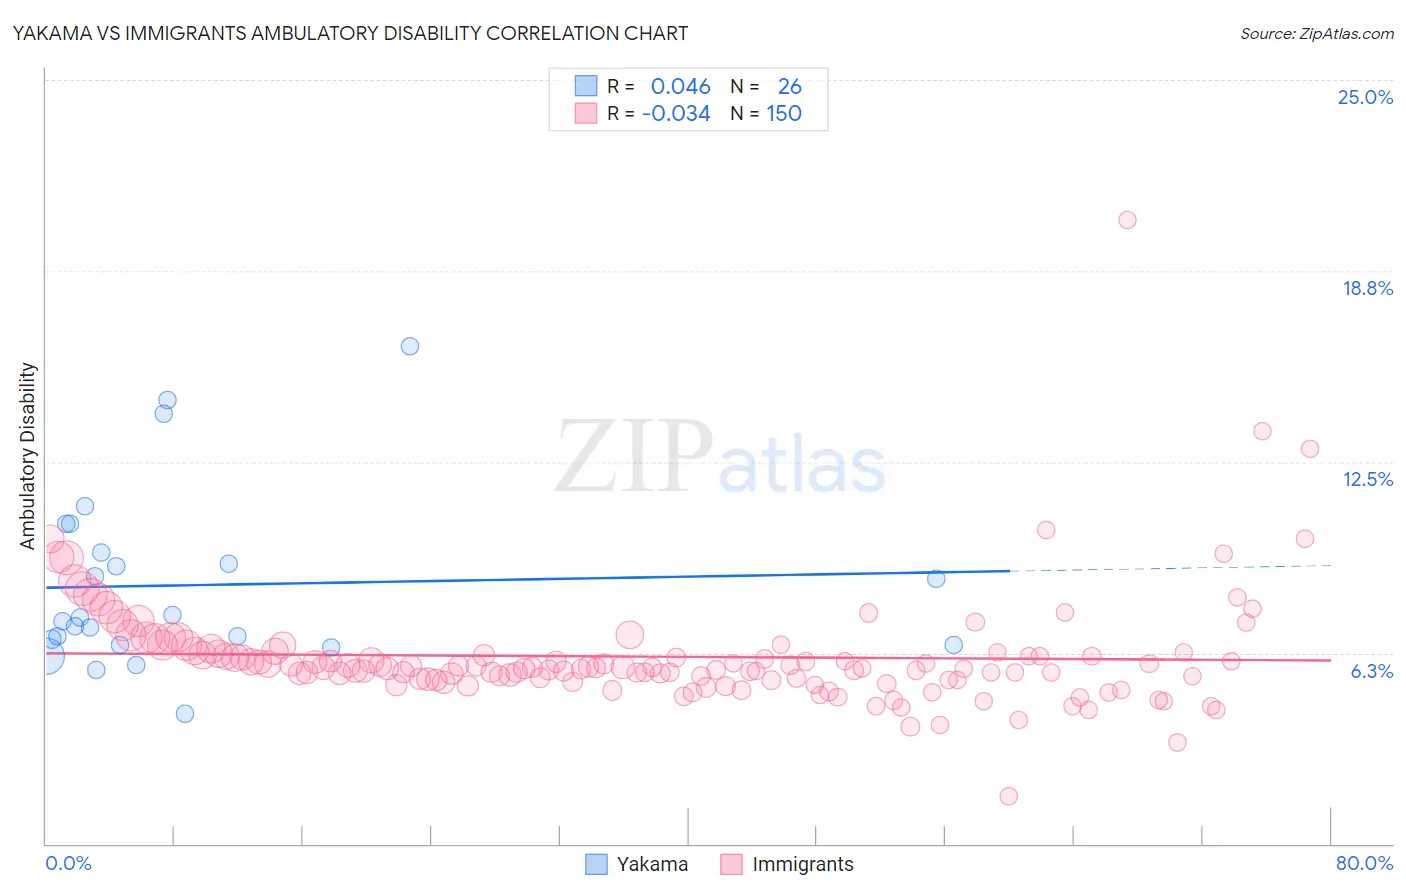
Yakama vs Immigrants Ambulatory Disability Correlation Chart
The statistical analysis conducted on geographies consisting of 19,917,759 people shows no correlation between the proportion of Yakama and percentage of population with ambulatory disability in the United States with a correlation coefficient (R) of 0.046 and weighted average of 6.8%. Similarly, the statistical analysis conducted on geographies consisting of 577,108,062 people shows no correlation between the proportion of Immigrants and percentage of population with ambulatory disability in the United States with a correlation coefficient (R) of -0.034 and weighted average of 6.0%, a difference of 14.2%.
Ambulatory Disability Correlation Summary
| Measurement | Yakama | Immigrants |
| Minimum | 4.2% | 1.6% |
| Maximum | 16.3% | 20.4% |
| Range | 12.0% | 18.8% |
| Mean | 8.5% | 6.1% |
| Median | 7.3% | 5.8% |
| Interquartile 25% (IQ1) | 6.5% | 5.4% |
| Interquartile 75% (IQ3) | 9.5% | 6.2% |
| Interquartile Range (IQR) | 3.0% | 0.89% |
| Standard Deviation (Sample) | 2.9% | 1.9% |
| Standard Deviation (Population) | 2.9% | 1.9% |
Similar Demographics by Ambulatory Disability
Demographics Similar to Yakama by Ambulatory Disability
In terms of ambulatory disability, the demographic groups most similar to Yakama are Fijian (6.8%, a difference of 0.040%), U.S. Virgin Islander (6.8%, a difference of 0.32%), Immigrants from Jamaica (6.8%, a difference of 0.45%), Immigrants from Barbados (6.8%, a difference of 0.52%), and Nonimmigrants (6.9%, a difference of 0.60%).
| Demographics | Rating | Rank | Ambulatory Disability |
| Immigrants | Caribbean | 0.0 /100 | #279 | Tragic 6.7% |
| Pennsylvania Germans | 0.0 /100 | #280 | Tragic 6.8% |
| Yaqui | 0.0 /100 | #281 | Tragic 6.8% |
| Barbadians | 0.0 /100 | #282 | Tragic 6.8% |
| Immigrants | Barbados | 0.0 /100 | #283 | Tragic 6.8% |
| Immigrants | Jamaica | 0.0 /100 | #284 | Tragic 6.8% |
| Fijians | 0.0 /100 | #285 | Tragic 6.8% |
| Yakama | 0.0 /100 | #286 | Tragic 6.8% |
| U.S. Virgin Islanders | 0.0 /100 | #287 | Tragic 6.8% |
| Immigrants | Nonimmigrants | 0.0 /100 | #288 | Tragic 6.9% |
| Immigrants | Dominica | 0.0 /100 | #289 | Tragic 6.9% |
| Scotch-Irish | 0.0 /100 | #290 | Tragic 6.9% |
| West Indians | 0.0 /100 | #291 | Tragic 6.9% |
| Cheyenne | 0.0 /100 | #292 | Tragic 6.9% |
| Immigrants | St. Vincent and the Grenadines | 0.0 /100 | #293 | Tragic 6.9% |
Demographics Similar to Immigrants by Ambulatory Disability
In terms of ambulatory disability, the demographic groups most similar to Immigrants are Ute (6.0%, a difference of 0.040%), Immigrants from Europe (6.0%, a difference of 0.11%), Immigrants from Italy (6.0%, a difference of 0.22%), Immigrants from North Macedonia (6.0%, a difference of 0.31%), and Immigrants from Syria (6.0%, a difference of 0.31%).
| Demographics | Rating | Rank | Ambulatory Disability |
| Arabs | 91.5 /100 | #126 | Exceptional 5.9% |
| Immigrants | Nigeria | 90.9 /100 | #127 | Exceptional 5.9% |
| Immigrants | Western Asia | 90.7 /100 | #128 | Exceptional 5.9% |
| Immigrants | Norway | 90.5 /100 | #129 | Exceptional 5.9% |
| Immigrants | Kazakhstan | 89.7 /100 | #130 | Excellent 5.9% |
| Immigrants | Costa Rica | 89.5 /100 | #131 | Excellent 5.9% |
| Immigrants | Europe | 87.8 /100 | #132 | Excellent 6.0% |
| Immigrants | Immigrants | 86.9 /100 | #133 | Excellent 6.0% |
| Ute | 86.6 /100 | #134 | Excellent 6.0% |
| Immigrants | Italy | 85.0 /100 | #135 | Excellent 6.0% |
| Immigrants | North Macedonia | 84.1 /100 | #136 | Excellent 6.0% |
| Immigrants | Syria | 84.1 /100 | #137 | Excellent 6.0% |
| Immigrants | Hungary | 83.9 /100 | #138 | Excellent 6.0% |
| Immigrants | Zaire | 83.6 /100 | #139 | Excellent 6.0% |
| Czechs | 83.3 /100 | #140 | Excellent 6.0% |