French Canadian vs Immigrants Ambulatory Disability
COMPARE
French Canadian
Immigrants
Ambulatory Disability
Ambulatory Disability Comparison
French Canadians
Immigrants
6.7%
AMBULATORY DISABILITY
0.1/ 100
METRIC RATING
272nd/ 347
METRIC RANK
6.0%
AMBULATORY DISABILITY
86.9/ 100
METRIC RATING
133rd/ 347
METRIC RANK
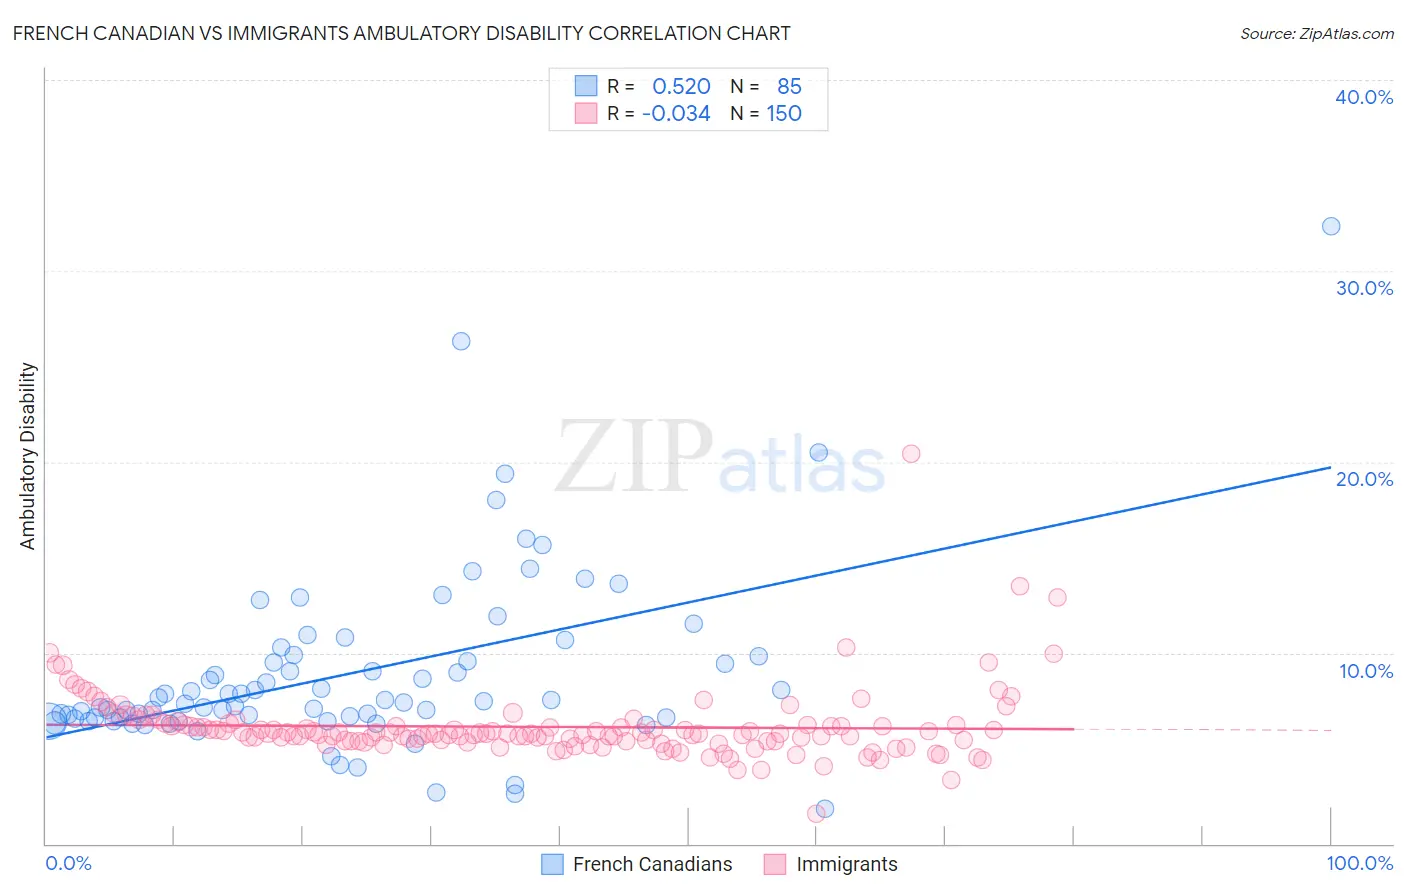
French Canadian vs Immigrants Ambulatory Disability Correlation Chart
The statistical analysis conducted on geographies consisting of 502,380,239 people shows a substantial positive correlation between the proportion of French Canadians and percentage of population with ambulatory disability in the United States with a correlation coefficient (R) of 0.520 and weighted average of 6.7%. Similarly, the statistical analysis conducted on geographies consisting of 577,108,062 people shows no correlation between the proportion of Immigrants and percentage of population with ambulatory disability in the United States with a correlation coefficient (R) of -0.034 and weighted average of 6.0%, a difference of 12.2%.
Ambulatory Disability Correlation Summary
| Measurement | French Canadian | Immigrants |
| Minimum | 1.8% | 1.6% |
| Maximum | 32.4% | 20.4% |
| Range | 30.5% | 18.8% |
| Mean | 9.0% | 6.1% |
| Median | 7.4% | 5.8% |
| Interquartile 25% (IQ1) | 6.6% | 5.4% |
| Interquartile 75% (IQ3) | 9.9% | 6.2% |
| Interquartile Range (IQR) | 3.3% | 0.89% |
| Standard Deviation (Sample) | 4.7% | 1.9% |
| Standard Deviation (Population) | 4.7% | 1.9% |
Similar Demographics by Ambulatory Disability
Demographics Similar to French Canadians by Ambulatory Disability
In terms of ambulatory disability, the demographic groups most similar to French Canadians are White/Caucasian (6.7%, a difference of 0.020%), Sioux (6.7%, a difference of 0.26%), Immigrants from Guyana (6.7%, a difference of 0.32%), Celtic (6.7%, a difference of 0.35%), and Immigrants from Trinidad and Tobago (6.7%, a difference of 0.36%).
| Demographics | Rating | Rank | Ambulatory Disability |
| Bahamians | 0.2 /100 | #265 | Tragic 6.6% |
| Guyanese | 0.2 /100 | #266 | Tragic 6.6% |
| Trinidadians and Tobagonians | 0.2 /100 | #267 | Tragic 6.6% |
| Spanish | 0.2 /100 | #268 | Tragic 6.6% |
| French | 0.1 /100 | #269 | Tragic 6.6% |
| Slovaks | 0.1 /100 | #270 | Tragic 6.7% |
| Immigrants | Trinidad and Tobago | 0.1 /100 | #271 | Tragic 6.7% |
| French Canadians | 0.1 /100 | #272 | Tragic 6.7% |
| Whites/Caucasians | 0.1 /100 | #273 | Tragic 6.7% |
| Sioux | 0.1 /100 | #274 | Tragic 6.7% |
| Immigrants | Guyana | 0.1 /100 | #275 | Tragic 6.7% |
| Celtics | 0.1 /100 | #276 | Tragic 6.7% |
| Jamaicans | 0.1 /100 | #277 | Tragic 6.7% |
| Immigrants | West Indies | 0.1 /100 | #278 | Tragic 6.7% |
| Immigrants | Caribbean | 0.0 /100 | #279 | Tragic 6.7% |
Demographics Similar to Immigrants by Ambulatory Disability
In terms of ambulatory disability, the demographic groups most similar to Immigrants are Ute (6.0%, a difference of 0.040%), Immigrants from Europe (6.0%, a difference of 0.11%), Immigrants from Italy (6.0%, a difference of 0.22%), Immigrants from North Macedonia (6.0%, a difference of 0.31%), and Immigrants from Syria (6.0%, a difference of 0.31%).
| Demographics | Rating | Rank | Ambulatory Disability |
| Arabs | 91.5 /100 | #126 | Exceptional 5.9% |
| Immigrants | Nigeria | 90.9 /100 | #127 | Exceptional 5.9% |
| Immigrants | Western Asia | 90.7 /100 | #128 | Exceptional 5.9% |
| Immigrants | Norway | 90.5 /100 | #129 | Exceptional 5.9% |
| Immigrants | Kazakhstan | 89.7 /100 | #130 | Excellent 5.9% |
| Immigrants | Costa Rica | 89.5 /100 | #131 | Excellent 5.9% |
| Immigrants | Europe | 87.8 /100 | #132 | Excellent 6.0% |
| Immigrants | Immigrants | 86.9 /100 | #133 | Excellent 6.0% |
| Ute | 86.6 /100 | #134 | Excellent 6.0% |
| Immigrants | Italy | 85.0 /100 | #135 | Excellent 6.0% |
| Immigrants | North Macedonia | 84.1 /100 | #136 | Excellent 6.0% |
| Immigrants | Syria | 84.1 /100 | #137 | Excellent 6.0% |
| Immigrants | Hungary | 83.9 /100 | #138 | Excellent 6.0% |
| Immigrants | Zaire | 83.6 /100 | #139 | Excellent 6.0% |
| Czechs | 83.3 /100 | #140 | Excellent 6.0% |