Scottish vs Immigrants Ambulatory Disability
COMPARE
Scottish
Immigrants
Ambulatory Disability
Ambulatory Disability Comparison
Scottish
Immigrants
6.5%
AMBULATORY DISABILITY
0.7/ 100
METRIC RATING
253rd/ 347
METRIC RANK
6.0%
AMBULATORY DISABILITY
86.9/ 100
METRIC RATING
133rd/ 347
METRIC RANK
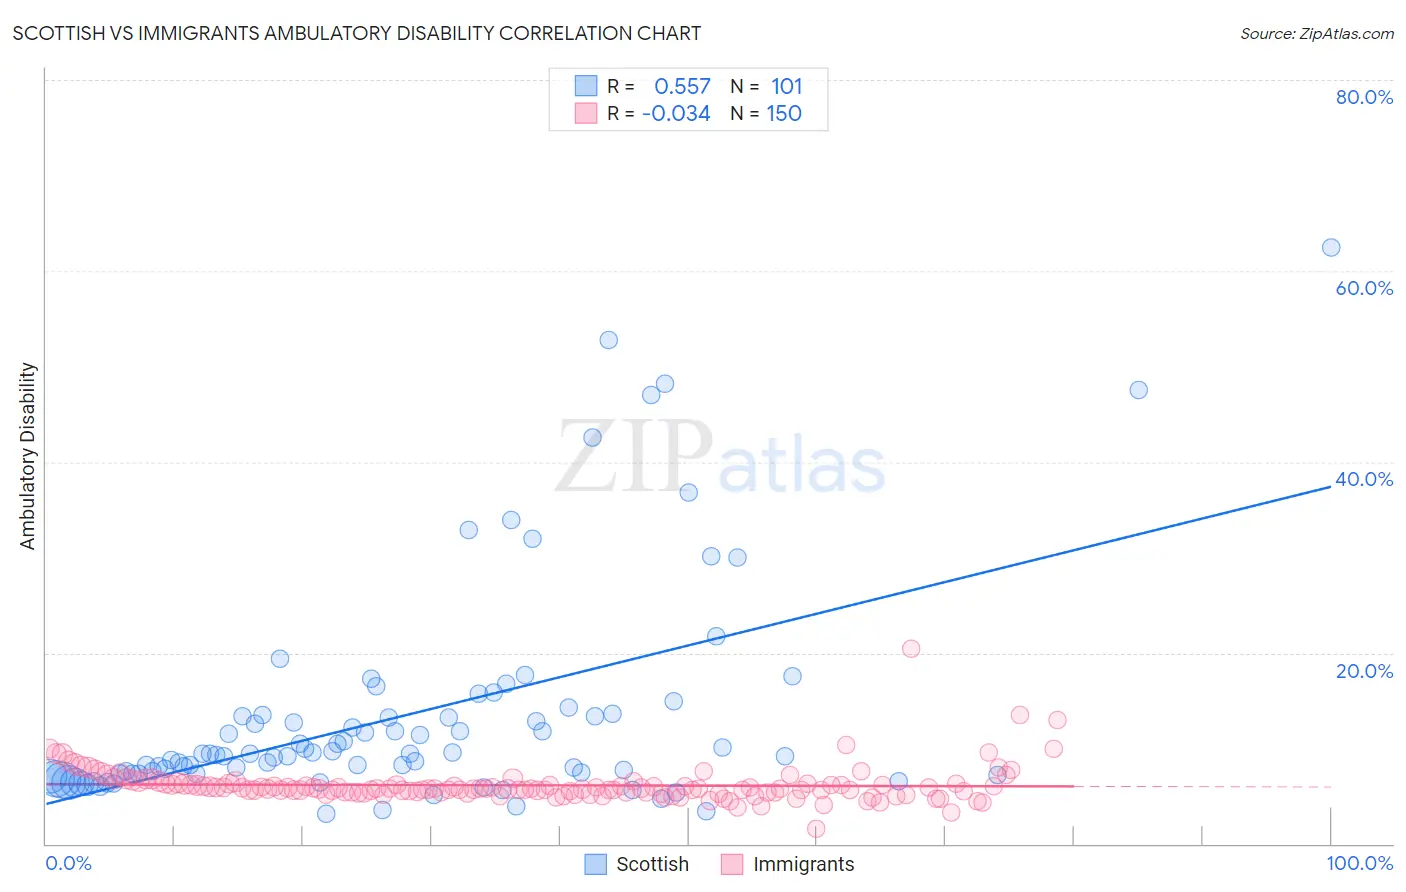
Scottish vs Immigrants Ambulatory Disability Correlation Chart
The statistical analysis conducted on geographies consisting of 566,616,487 people shows a substantial positive correlation between the proportion of Scottish and percentage of population with ambulatory disability in the United States with a correlation coefficient (R) of 0.557 and weighted average of 6.5%. Similarly, the statistical analysis conducted on geographies consisting of 577,108,062 people shows no correlation between the proportion of Immigrants and percentage of population with ambulatory disability in the United States with a correlation coefficient (R) of -0.034 and weighted average of 6.0%, a difference of 9.2%.
Ambulatory Disability Correlation Summary
| Measurement | Scottish | Immigrants |
| Minimum | 3.1% | 1.6% |
| Maximum | 62.5% | 20.4% |
| Range | 59.4% | 18.8% |
| Mean | 13.4% | 6.1% |
| Median | 9.4% | 5.8% |
| Interquartile 25% (IQ1) | 7.3% | 5.4% |
| Interquartile 75% (IQ3) | 13.4% | 6.2% |
| Interquartile Range (IQR) | 6.1% | 0.89% |
| Standard Deviation (Sample) | 11.4% | 1.9% |
| Standard Deviation (Population) | 11.4% | 1.9% |
Similar Demographics by Ambulatory Disability
Demographics Similar to Scottish by Ambulatory Disability
In terms of ambulatory disability, the demographic groups most similar to Scottish are Immigrants from Bahamas (6.5%, a difference of 0.050%), Belizean (6.5%, a difference of 0.16%), Welsh (6.5%, a difference of 0.23%), Hawaiian (6.5%, a difference of 0.25%), and Immigrants from Uzbekistan (6.5%, a difference of 0.30%).
| Demographics | Rating | Rank | Ambulatory Disability |
| Armenians | 1.5 /100 | #246 | Tragic 6.5% |
| Immigrants | Cuba | 1.4 /100 | #247 | Tragic 6.5% |
| Immigrants | Portugal | 1.4 /100 | #248 | Tragic 6.5% |
| Native Hawaiians | 1.1 /100 | #249 | Tragic 6.5% |
| Chinese | 1.0 /100 | #250 | Tragic 6.5% |
| Hawaiians | 0.9 /100 | #251 | Tragic 6.5% |
| Immigrants | Bahamas | 0.8 /100 | #252 | Tragic 6.5% |
| Scottish | 0.7 /100 | #253 | Tragic 6.5% |
| Belizeans | 0.7 /100 | #254 | Tragic 6.5% |
| Welsh | 0.6 /100 | #255 | Tragic 6.5% |
| Immigrants | Uzbekistan | 0.6 /100 | #256 | Tragic 6.5% |
| Bermudans | 0.5 /100 | #257 | Tragic 6.5% |
| Spanish American Indians | 0.5 /100 | #258 | Tragic 6.5% |
| Aleuts | 0.4 /100 | #259 | Tragic 6.6% |
| Immigrants | Belize | 0.4 /100 | #260 | Tragic 6.6% |
Demographics Similar to Immigrants by Ambulatory Disability
In terms of ambulatory disability, the demographic groups most similar to Immigrants are Ute (6.0%, a difference of 0.040%), Immigrants from Europe (6.0%, a difference of 0.11%), Immigrants from Italy (6.0%, a difference of 0.22%), Immigrants from North Macedonia (6.0%, a difference of 0.31%), and Immigrants from Syria (6.0%, a difference of 0.31%).
| Demographics | Rating | Rank | Ambulatory Disability |
| Arabs | 91.5 /100 | #126 | Exceptional 5.9% |
| Immigrants | Nigeria | 90.9 /100 | #127 | Exceptional 5.9% |
| Immigrants | Western Asia | 90.7 /100 | #128 | Exceptional 5.9% |
| Immigrants | Norway | 90.5 /100 | #129 | Exceptional 5.9% |
| Immigrants | Kazakhstan | 89.7 /100 | #130 | Excellent 5.9% |
| Immigrants | Costa Rica | 89.5 /100 | #131 | Excellent 5.9% |
| Immigrants | Europe | 87.8 /100 | #132 | Excellent 6.0% |
| Immigrants | Immigrants | 86.9 /100 | #133 | Excellent 6.0% |
| Ute | 86.6 /100 | #134 | Excellent 6.0% |
| Immigrants | Italy | 85.0 /100 | #135 | Excellent 6.0% |
| Immigrants | North Macedonia | 84.1 /100 | #136 | Excellent 6.0% |
| Immigrants | Syria | 84.1 /100 | #137 | Excellent 6.0% |
| Immigrants | Hungary | 83.9 /100 | #138 | Excellent 6.0% |
| Immigrants | Zaire | 83.6 /100 | #139 | Excellent 6.0% |
| Czechs | 83.3 /100 | #140 | Excellent 6.0% |