Assyrian/Chaldean/Syriac vs Immigrants Ambulatory Disability
COMPARE
Assyrian/Chaldean/Syriac
Immigrants
Ambulatory Disability
Ambulatory Disability Comparison
Assyrians/Chaldeans/Syriacs
Immigrants
6.4%
AMBULATORY DISABILITY
2.4/ 100
METRIC RATING
232nd/ 347
METRIC RANK
6.0%
AMBULATORY DISABILITY
86.9/ 100
METRIC RATING
133rd/ 347
METRIC RANK
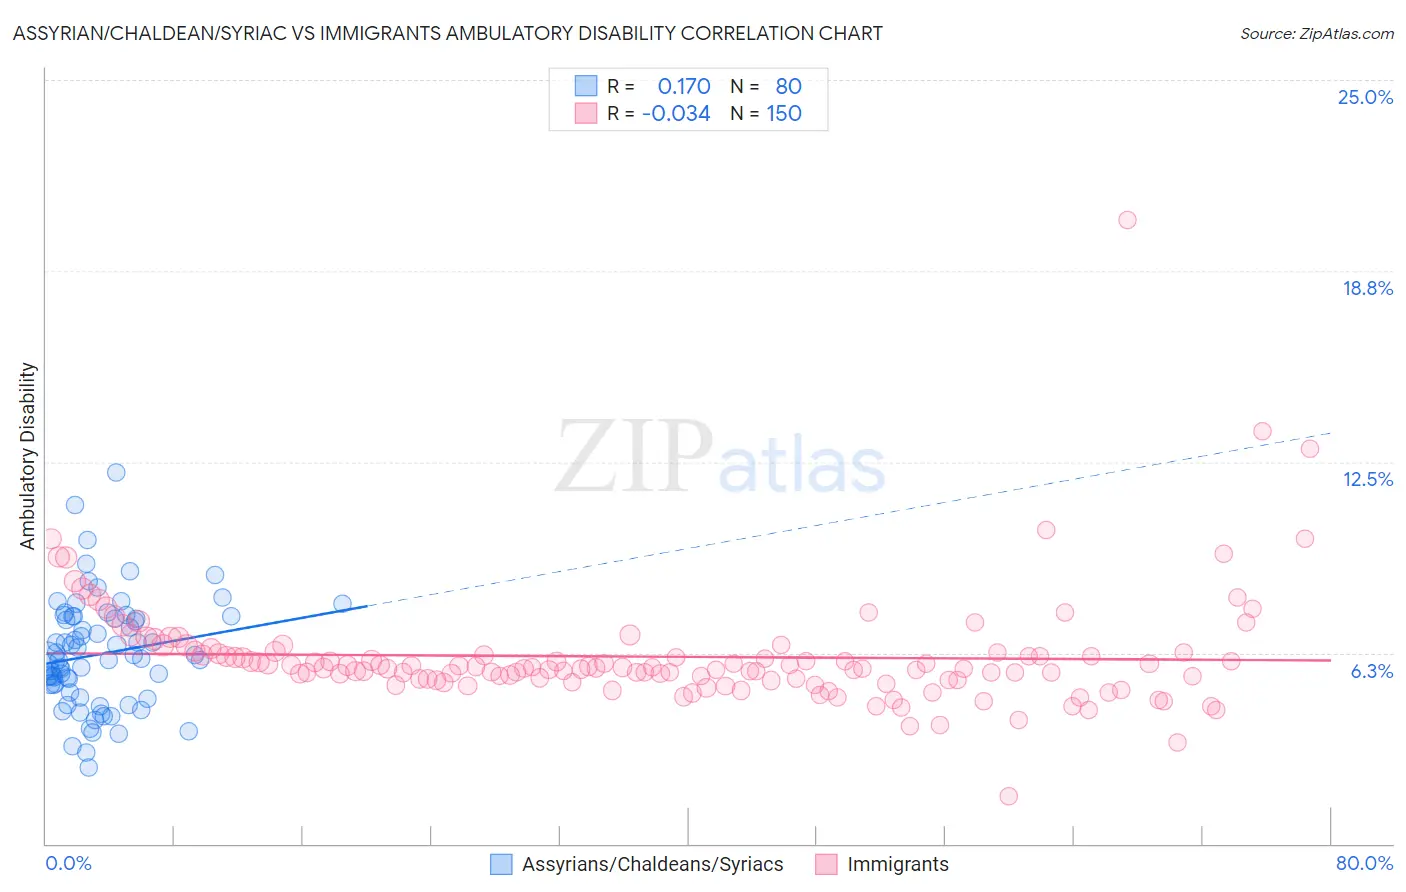
Assyrian/Chaldean/Syriac vs Immigrants Ambulatory Disability Correlation Chart
The statistical analysis conducted on geographies consisting of 110,309,207 people shows a poor positive correlation between the proportion of Assyrians/Chaldeans/Syriacs and percentage of population with ambulatory disability in the United States with a correlation coefficient (R) of 0.170 and weighted average of 6.4%. Similarly, the statistical analysis conducted on geographies consisting of 577,108,062 people shows no correlation between the proportion of Immigrants and percentage of population with ambulatory disability in the United States with a correlation coefficient (R) of -0.034 and weighted average of 6.0%, a difference of 7.6%.
Ambulatory Disability Correlation Summary
| Measurement | Assyrian/Chaldean/Syriac | Immigrants |
| Minimum | 2.5% | 1.6% |
| Maximum | 12.1% | 20.4% |
| Range | 9.7% | 18.8% |
| Mean | 6.2% | 6.1% |
| Median | 6.1% | 5.8% |
| Interquartile 25% (IQ1) | 5.1% | 5.4% |
| Interquartile 75% (IQ3) | 7.4% | 6.2% |
| Interquartile Range (IQR) | 2.3% | 0.89% |
| Standard Deviation (Sample) | 1.8% | 1.9% |
| Standard Deviation (Population) | 1.8% | 1.9% |
Similar Demographics by Ambulatory Disability
Demographics Similar to Assyrians/Chaldeans/Syriacs by Ambulatory Disability
In terms of ambulatory disability, the demographic groups most similar to Assyrians/Chaldeans/Syriacs are Subsaharan African (6.4%, a difference of 0.060%), Immigrants from Liberia (6.4%, a difference of 0.090%), Hispanic or Latino (6.4%, a difference of 0.12%), Dutch (6.4%, a difference of 0.27%), and Panamanian (6.4%, a difference of 0.33%).
| Demographics | Rating | Rank | Ambulatory Disability |
| Hondurans | 6.3 /100 | #225 | Tragic 6.3% |
| Slavs | 5.1 /100 | #226 | Tragic 6.4% |
| Cubans | 4.0 /100 | #227 | Tragic 6.4% |
| Portuguese | 4.0 /100 | #228 | Tragic 6.4% |
| Czechoslovakians | 3.8 /100 | #229 | Tragic 6.4% |
| Mexicans | 3.5 /100 | #230 | Tragic 6.4% |
| Panamanians | 3.1 /100 | #231 | Tragic 6.4% |
| Assyrians/Chaldeans/Syriacs | 2.4 /100 | #232 | Tragic 6.4% |
| Sub-Saharan Africans | 2.3 /100 | #233 | Tragic 6.4% |
| Immigrants | Liberia | 2.3 /100 | #234 | Tragic 6.4% |
| Hispanics or Latinos | 2.2 /100 | #235 | Tragic 6.4% |
| Dutch | 2.0 /100 | #236 | Tragic 6.4% |
| Immigrants | Germany | 1.8 /100 | #237 | Tragic 6.4% |
| Haitians | 1.8 /100 | #238 | Tragic 6.4% |
| Senegalese | 1.7 /100 | #239 | Tragic 6.4% |
Demographics Similar to Immigrants by Ambulatory Disability
In terms of ambulatory disability, the demographic groups most similar to Immigrants are Ute (6.0%, a difference of 0.040%), Immigrants from Europe (6.0%, a difference of 0.11%), Immigrants from Italy (6.0%, a difference of 0.22%), Immigrants from North Macedonia (6.0%, a difference of 0.31%), and Immigrants from Syria (6.0%, a difference of 0.31%).
| Demographics | Rating | Rank | Ambulatory Disability |
| Arabs | 91.5 /100 | #126 | Exceptional 5.9% |
| Immigrants | Nigeria | 90.9 /100 | #127 | Exceptional 5.9% |
| Immigrants | Western Asia | 90.7 /100 | #128 | Exceptional 5.9% |
| Immigrants | Norway | 90.5 /100 | #129 | Exceptional 5.9% |
| Immigrants | Kazakhstan | 89.7 /100 | #130 | Excellent 5.9% |
| Immigrants | Costa Rica | 89.5 /100 | #131 | Excellent 5.9% |
| Immigrants | Europe | 87.8 /100 | #132 | Excellent 6.0% |
| Immigrants | Immigrants | 86.9 /100 | #133 | Excellent 6.0% |
| Ute | 86.6 /100 | #134 | Excellent 6.0% |
| Immigrants | Italy | 85.0 /100 | #135 | Excellent 6.0% |
| Immigrants | North Macedonia | 84.1 /100 | #136 | Excellent 6.0% |
| Immigrants | Syria | 84.1 /100 | #137 | Excellent 6.0% |
| Immigrants | Hungary | 83.9 /100 | #138 | Excellent 6.0% |
| Immigrants | Zaire | 83.6 /100 | #139 | Excellent 6.0% |
| Czechs | 83.3 /100 | #140 | Excellent 6.0% |