Yakama vs Cheyenne Ambulatory Disability
COMPARE
Yakama
Cheyenne
Ambulatory Disability
Ambulatory Disability Comparison
Yakama
Cheyenne
6.8%
AMBULATORY DISABILITY
0.0/ 100
METRIC RATING
286th/ 347
METRIC RANK
6.9%
AMBULATORY DISABILITY
0.0/ 100
METRIC RATING
292nd/ 347
METRIC RANK
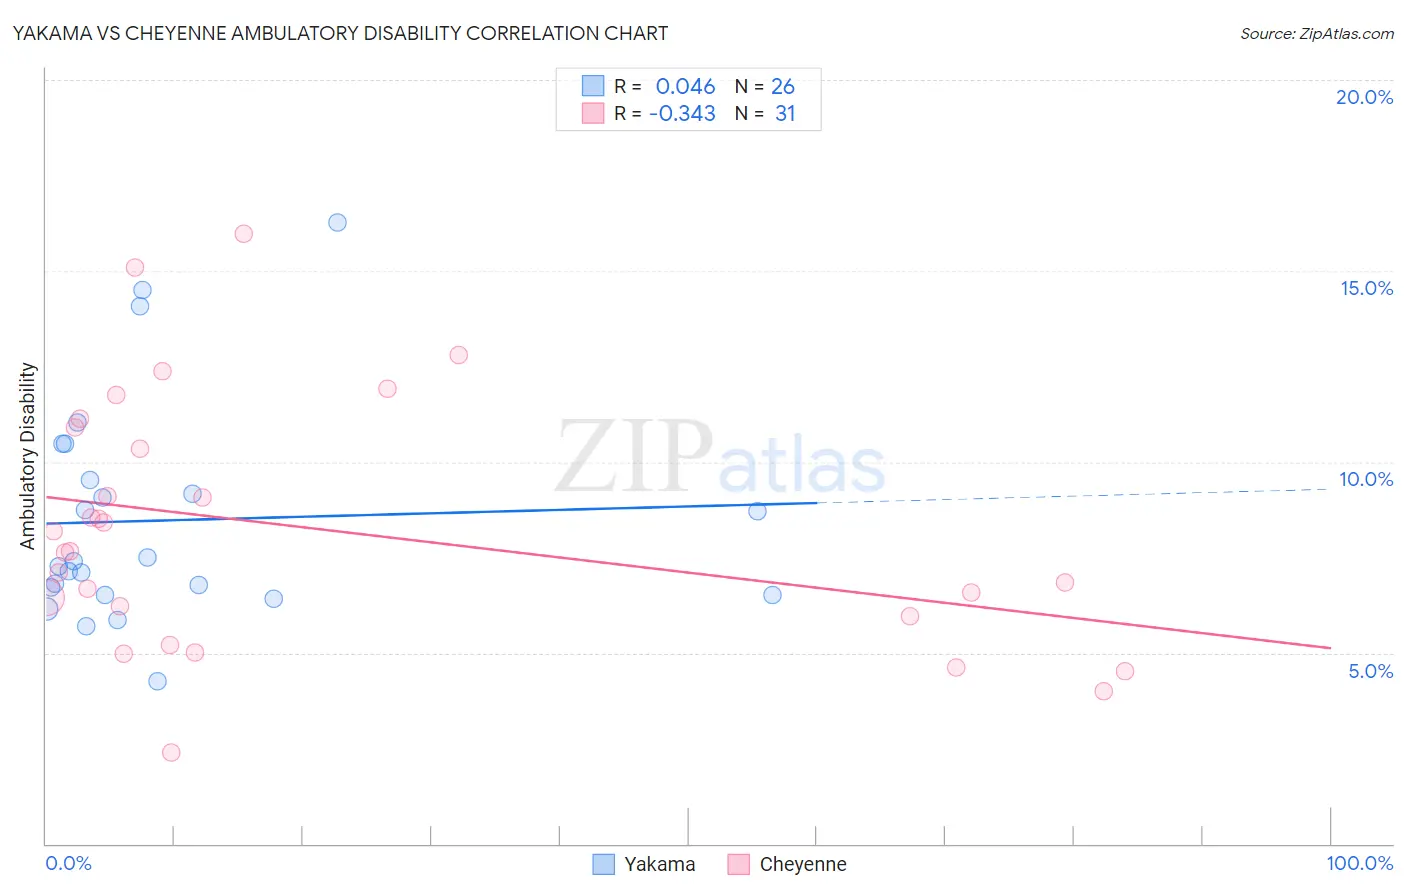
Yakama vs Cheyenne Ambulatory Disability Correlation Chart
The statistical analysis conducted on geographies consisting of 19,917,759 people shows no correlation between the proportion of Yakama and percentage of population with ambulatory disability in the United States with a correlation coefficient (R) of 0.046 and weighted average of 6.8%. Similarly, the statistical analysis conducted on geographies consisting of 80,709,712 people shows a mild negative correlation between the proportion of Cheyenne and percentage of population with ambulatory disability in the United States with a correlation coefficient (R) of -0.343 and weighted average of 6.9%, a difference of 0.93%.
Ambulatory Disability Correlation Summary
| Measurement | Yakama | Cheyenne |
| Minimum | 4.2% | 2.4% |
| Maximum | 16.3% | 16.0% |
| Range | 12.0% | 13.6% |
| Mean | 8.5% | 8.3% |
| Median | 7.3% | 7.7% |
| Interquartile 25% (IQ1) | 6.5% | 6.0% |
| Interquartile 75% (IQ3) | 9.5% | 10.9% |
| Interquartile Range (IQR) | 3.0% | 4.9% |
| Standard Deviation (Sample) | 2.9% | 3.3% |
| Standard Deviation (Population) | 2.9% | 3.2% |
Demographics Similar to Yakama and Cheyenne by Ambulatory Disability
In terms of ambulatory disability, the demographic groups most similar to Yakama are Fijian (6.8%, a difference of 0.040%), U.S. Virgin Islander (6.8%, a difference of 0.32%), Immigrants from Jamaica (6.8%, a difference of 0.45%), Immigrants from Barbados (6.8%, a difference of 0.52%), and Nonimmigrants (6.9%, a difference of 0.60%). Similarly, the demographic groups most similar to Cheyenne are West Indian (6.9%, a difference of 0.060%), Scotch-Irish (6.9%, a difference of 0.16%), Immigrants from Dominica (6.9%, a difference of 0.19%), Immigrants from St. Vincent and the Grenadines (6.9%, a difference of 0.24%), and Nonimmigrants (6.9%, a difference of 0.33%).
| Demographics | Rating | Rank | Ambulatory Disability |
| Immigrants | Caribbean | 0.0 /100 | #279 | Tragic 6.7% |
| Pennsylvania Germans | 0.0 /100 | #280 | Tragic 6.8% |
| Yaqui | 0.0 /100 | #281 | Tragic 6.8% |
| Barbadians | 0.0 /100 | #282 | Tragic 6.8% |
| Immigrants | Barbados | 0.0 /100 | #283 | Tragic 6.8% |
| Immigrants | Jamaica | 0.0 /100 | #284 | Tragic 6.8% |
| Fijians | 0.0 /100 | #285 | Tragic 6.8% |
| Yakama | 0.0 /100 | #286 | Tragic 6.8% |
| U.S. Virgin Islanders | 0.0 /100 | #287 | Tragic 6.8% |
| Immigrants | Nonimmigrants | 0.0 /100 | #288 | Tragic 6.9% |
| Immigrants | Dominica | 0.0 /100 | #289 | Tragic 6.9% |
| Scotch-Irish | 0.0 /100 | #290 | Tragic 6.9% |
| West Indians | 0.0 /100 | #291 | Tragic 6.9% |
| Cheyenne | 0.0 /100 | #292 | Tragic 6.9% |
| Immigrants | St. Vincent and the Grenadines | 0.0 /100 | #293 | Tragic 6.9% |
| Cape Verdeans | 0.0 /100 | #294 | Tragic 6.9% |
| Crow | 0.0 /100 | #295 | Tragic 6.9% |
| Alaskan Athabascans | 0.0 /100 | #296 | Tragic 6.9% |
| French American Indians | 0.0 /100 | #297 | Tragic 6.9% |
| Immigrants | Grenada | 0.0 /100 | #298 | Tragic 6.9% |
| Puget Sound Salish | 0.0 /100 | #299 | Tragic 6.9% |