Yakama vs Immigrants from Pakistan Ambulatory Disability
COMPARE
Yakama
Immigrants from Pakistan
Ambulatory Disability
Ambulatory Disability Comparison
Yakama
Immigrants from Pakistan
6.8%
AMBULATORY DISABILITY
0.0/ 100
METRIC RATING
286th/ 347
METRIC RANK
5.5%
AMBULATORY DISABILITY
100.0/ 100
METRIC RATING
33rd/ 347
METRIC RANK
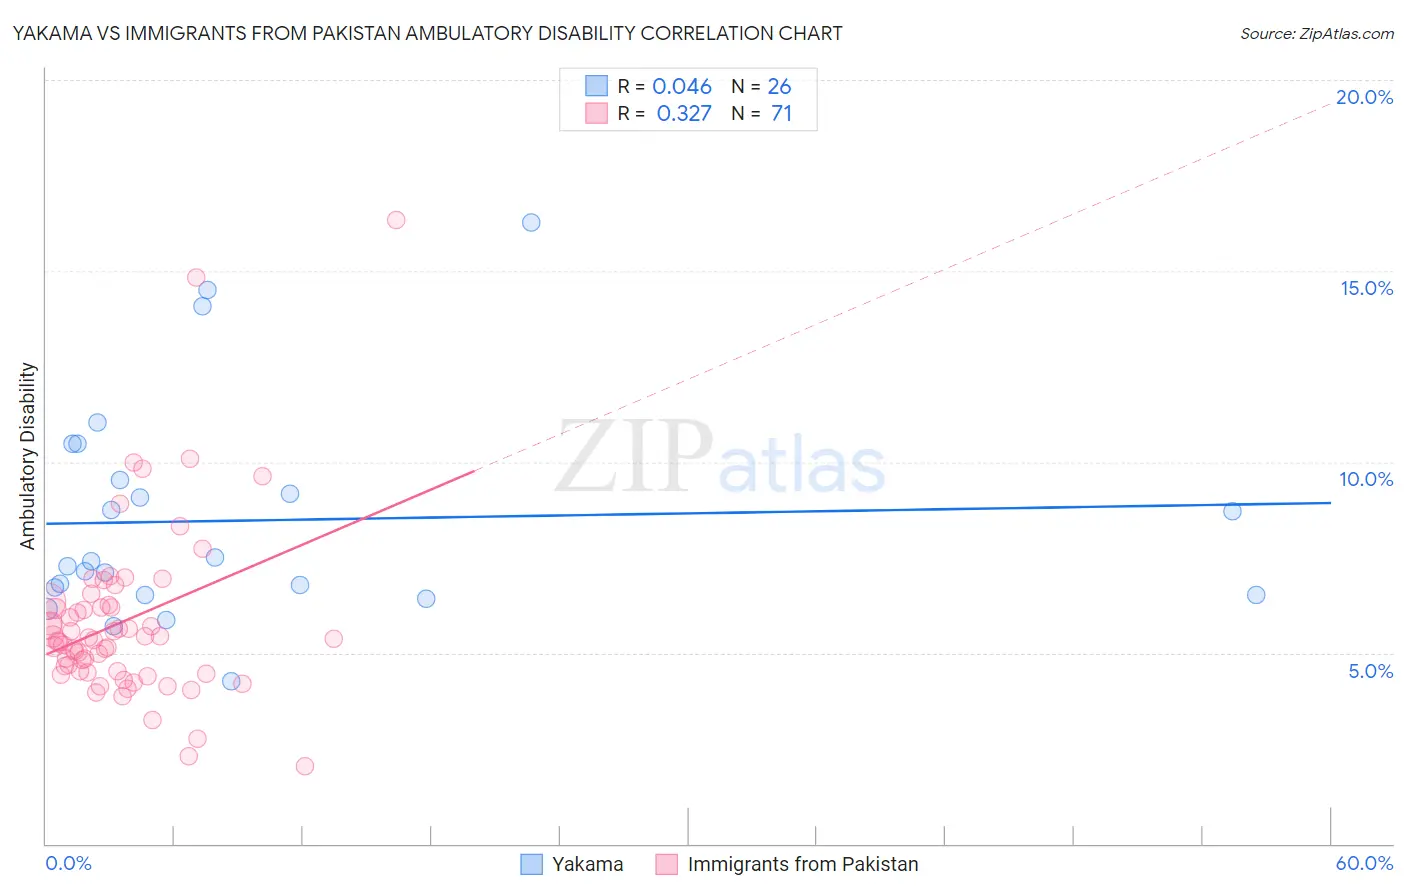
Yakama vs Immigrants from Pakistan Ambulatory Disability Correlation Chart
The statistical analysis conducted on geographies consisting of 19,917,759 people shows no correlation between the proportion of Yakama and percentage of population with ambulatory disability in the United States with a correlation coefficient (R) of 0.046 and weighted average of 6.8%. Similarly, the statistical analysis conducted on geographies consisting of 283,855,056 people shows a mild positive correlation between the proportion of Immigrants from Pakistan and percentage of population with ambulatory disability in the United States with a correlation coefficient (R) of 0.327 and weighted average of 5.5%, a difference of 24.7%.
Ambulatory Disability Correlation Summary
| Measurement | Yakama | Immigrants from Pakistan |
| Minimum | 4.2% | 2.0% |
| Maximum | 16.3% | 16.3% |
| Range | 12.0% | 14.3% |
| Mean | 8.5% | 5.8% |
| Median | 7.3% | 5.4% |
| Interquartile 25% (IQ1) | 6.5% | 4.5% |
| Interquartile 75% (IQ3) | 9.5% | 6.2% |
| Interquartile Range (IQR) | 3.0% | 1.7% |
| Standard Deviation (Sample) | 2.9% | 2.3% |
| Standard Deviation (Population) | 2.9% | 2.3% |
Similar Demographics by Ambulatory Disability
Demographics Similar to Yakama by Ambulatory Disability
In terms of ambulatory disability, the demographic groups most similar to Yakama are Fijian (6.8%, a difference of 0.040%), U.S. Virgin Islander (6.8%, a difference of 0.32%), Immigrants from Jamaica (6.8%, a difference of 0.45%), Immigrants from Barbados (6.8%, a difference of 0.52%), and Nonimmigrants (6.9%, a difference of 0.60%).
| Demographics | Rating | Rank | Ambulatory Disability |
| Immigrants | Caribbean | 0.0 /100 | #279 | Tragic 6.7% |
| Pennsylvania Germans | 0.0 /100 | #280 | Tragic 6.8% |
| Yaqui | 0.0 /100 | #281 | Tragic 6.8% |
| Barbadians | 0.0 /100 | #282 | Tragic 6.8% |
| Immigrants | Barbados | 0.0 /100 | #283 | Tragic 6.8% |
| Immigrants | Jamaica | 0.0 /100 | #284 | Tragic 6.8% |
| Fijians | 0.0 /100 | #285 | Tragic 6.8% |
| Yakama | 0.0 /100 | #286 | Tragic 6.8% |
| U.S. Virgin Islanders | 0.0 /100 | #287 | Tragic 6.8% |
| Immigrants | Nonimmigrants | 0.0 /100 | #288 | Tragic 6.9% |
| Immigrants | Dominica | 0.0 /100 | #289 | Tragic 6.9% |
| Scotch-Irish | 0.0 /100 | #290 | Tragic 6.9% |
| West Indians | 0.0 /100 | #291 | Tragic 6.9% |
| Cheyenne | 0.0 /100 | #292 | Tragic 6.9% |
| Immigrants | St. Vincent and the Grenadines | 0.0 /100 | #293 | Tragic 6.9% |
Demographics Similar to Immigrants from Pakistan by Ambulatory Disability
In terms of ambulatory disability, the demographic groups most similar to Immigrants from Pakistan are Immigrants from Australia (5.5%, a difference of 0.12%), Immigrants from Asia (5.5%, a difference of 0.16%), Afghan (5.5%, a difference of 0.20%), Immigrants from Malaysia (5.5%, a difference of 0.27%), and Turkish (5.5%, a difference of 0.28%).
| Demographics | Rating | Rank | Ambulatory Disability |
| Immigrants | Nepal | 100.0 /100 | #26 | Exceptional 5.4% |
| Asians | 100.0 /100 | #27 | Exceptional 5.4% |
| Cambodians | 100.0 /100 | #28 | Exceptional 5.4% |
| Immigrants | Iran | 100.0 /100 | #29 | Exceptional 5.4% |
| Immigrants | Turkey | 100.0 /100 | #30 | Exceptional 5.4% |
| Immigrants | Venezuela | 100.0 /100 | #31 | Exceptional 5.4% |
| Immigrants | Australia | 100.0 /100 | #32 | Exceptional 5.5% |
| Immigrants | Pakistan | 100.0 /100 | #33 | Exceptional 5.5% |
| Immigrants | Asia | 100.0 /100 | #34 | Exceptional 5.5% |
| Afghans | 100.0 /100 | #35 | Exceptional 5.5% |
| Immigrants | Malaysia | 100.0 /100 | #36 | Exceptional 5.5% |
| Turks | 100.0 /100 | #37 | Exceptional 5.5% |
| Cypriots | 100.0 /100 | #38 | Exceptional 5.5% |
| Immigrants | Eritrea | 100.0 /100 | #39 | Exceptional 5.5% |
| Venezuelans | 99.9 /100 | #40 | Exceptional 5.5% |