Yakama vs Immigrants from Singapore Ambulatory Disability
COMPARE
Yakama
Immigrants from Singapore
Ambulatory Disability
Ambulatory Disability Comparison
Yakama
Immigrants from Singapore
6.8%
AMBULATORY DISABILITY
0.0/ 100
METRIC RATING
286th/ 347
METRIC RANK
5.0%
AMBULATORY DISABILITY
100.0/ 100
METRIC RATING
5th/ 347
METRIC RANK
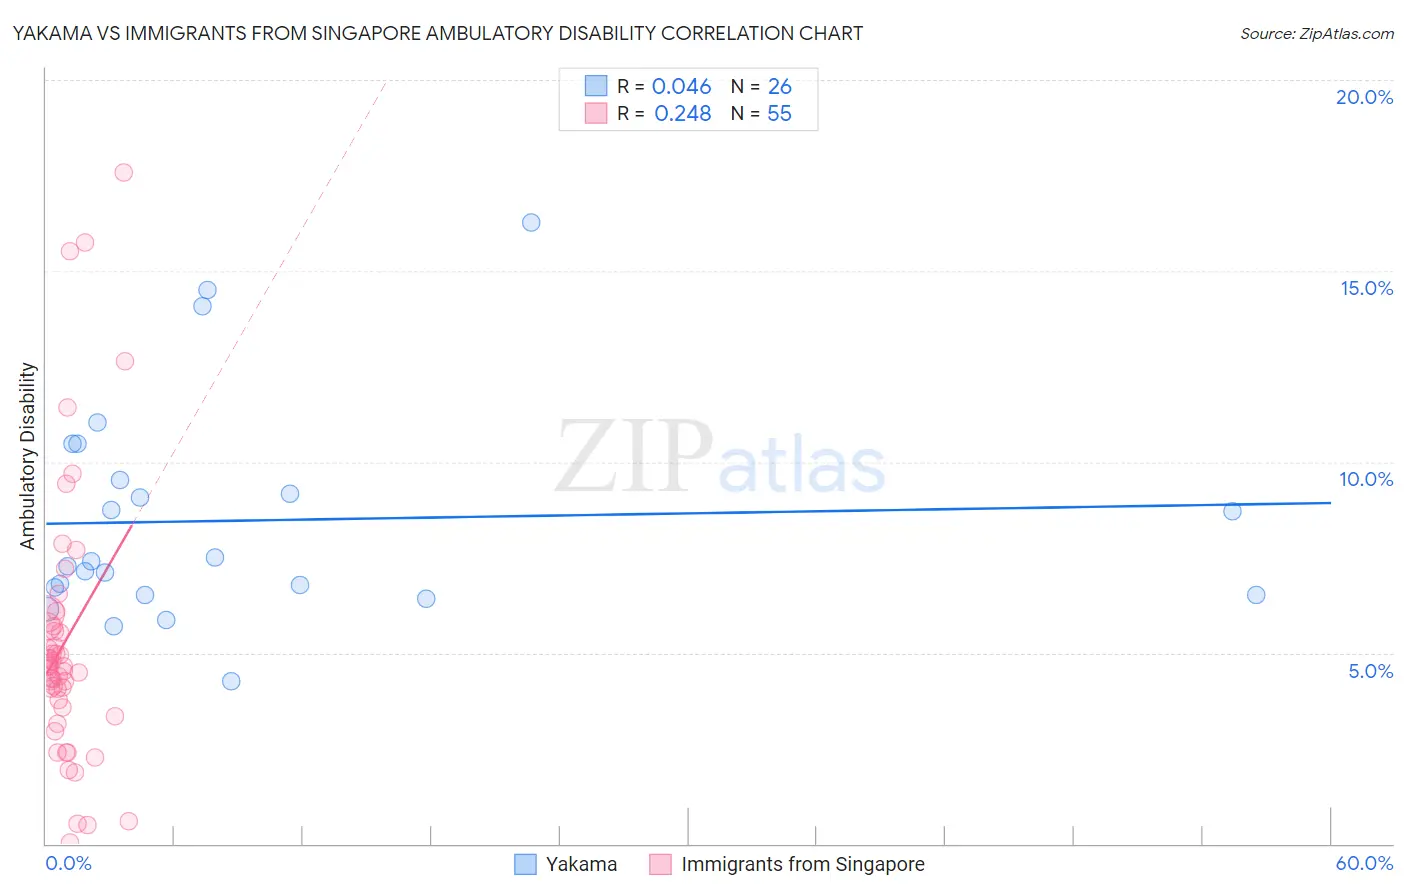
Yakama vs Immigrants from Singapore Ambulatory Disability Correlation Chart
The statistical analysis conducted on geographies consisting of 19,917,759 people shows no correlation between the proportion of Yakama and percentage of population with ambulatory disability in the United States with a correlation coefficient (R) of 0.046 and weighted average of 6.8%. Similarly, the statistical analysis conducted on geographies consisting of 137,492,636 people shows a weak positive correlation between the proportion of Immigrants from Singapore and percentage of population with ambulatory disability in the United States with a correlation coefficient (R) of 0.248 and weighted average of 5.0%, a difference of 36.1%.
Ambulatory Disability Correlation Summary
| Measurement | Yakama | Immigrants from Singapore |
| Minimum | 4.2% | 0.042% |
| Maximum | 16.3% | 17.6% |
| Range | 12.0% | 17.5% |
| Mean | 8.5% | 5.3% |
| Median | 7.3% | 4.6% |
| Interquartile 25% (IQ1) | 6.5% | 3.6% |
| Interquartile 75% (IQ3) | 9.5% | 5.7% |
| Interquartile Range (IQR) | 3.0% | 2.1% |
| Standard Deviation (Sample) | 2.9% | 3.6% |
| Standard Deviation (Population) | 2.9% | 3.6% |
Similar Demographics by Ambulatory Disability
Demographics Similar to Yakama by Ambulatory Disability
In terms of ambulatory disability, the demographic groups most similar to Yakama are Fijian (6.8%, a difference of 0.040%), U.S. Virgin Islander (6.8%, a difference of 0.32%), Immigrants from Jamaica (6.8%, a difference of 0.45%), Immigrants from Barbados (6.8%, a difference of 0.52%), and Nonimmigrants (6.9%, a difference of 0.60%).
| Demographics | Rating | Rank | Ambulatory Disability |
| Immigrants | Caribbean | 0.0 /100 | #279 | Tragic 6.7% |
| Pennsylvania Germans | 0.0 /100 | #280 | Tragic 6.8% |
| Yaqui | 0.0 /100 | #281 | Tragic 6.8% |
| Barbadians | 0.0 /100 | #282 | Tragic 6.8% |
| Immigrants | Barbados | 0.0 /100 | #283 | Tragic 6.8% |
| Immigrants | Jamaica | 0.0 /100 | #284 | Tragic 6.8% |
| Fijians | 0.0 /100 | #285 | Tragic 6.8% |
| Yakama | 0.0 /100 | #286 | Tragic 6.8% |
| U.S. Virgin Islanders | 0.0 /100 | #287 | Tragic 6.8% |
| Immigrants | Nonimmigrants | 0.0 /100 | #288 | Tragic 6.9% |
| Immigrants | Dominica | 0.0 /100 | #289 | Tragic 6.9% |
| Scotch-Irish | 0.0 /100 | #290 | Tragic 6.9% |
| West Indians | 0.0 /100 | #291 | Tragic 6.9% |
| Cheyenne | 0.0 /100 | #292 | Tragic 6.9% |
| Immigrants | St. Vincent and the Grenadines | 0.0 /100 | #293 | Tragic 6.9% |
Demographics Similar to Immigrants from Singapore by Ambulatory Disability
In terms of ambulatory disability, the demographic groups most similar to Immigrants from Singapore are Immigrants from Bolivia (5.0%, a difference of 0.68%), Bolivian (5.1%, a difference of 1.1%), Immigrants from Taiwan (4.9%, a difference of 1.4%), Thai (4.9%, a difference of 1.6%), and Immigrants from South Central Asia (5.1%, a difference of 2.1%).
| Demographics | Rating | Rank | Ambulatory Disability |
| Immigrants | India | 100.0 /100 | #1 | Exceptional 4.8% |
| Filipinos | 100.0 /100 | #2 | Exceptional 4.9% |
| Thais | 100.0 /100 | #3 | Exceptional 4.9% |
| Immigrants | Taiwan | 100.0 /100 | #4 | Exceptional 4.9% |
| Immigrants | Singapore | 100.0 /100 | #5 | Exceptional 5.0% |
| Immigrants | Bolivia | 100.0 /100 | #6 | Exceptional 5.0% |
| Bolivians | 100.0 /100 | #7 | Exceptional 5.1% |
| Immigrants | South Central Asia | 100.0 /100 | #8 | Exceptional 5.1% |
| Iranians | 100.0 /100 | #9 | Exceptional 5.1% |
| Yup'ik | 100.0 /100 | #10 | Exceptional 5.2% |
| Immigrants | Korea | 100.0 /100 | #11 | Exceptional 5.2% |
| Okinawans | 100.0 /100 | #12 | Exceptional 5.3% |
| Burmese | 100.0 /100 | #13 | Exceptional 5.3% |
| Immigrants | Eastern Asia | 100.0 /100 | #14 | Exceptional 5.3% |
| Immigrants | China | 100.0 /100 | #15 | Exceptional 5.3% |