Syrian vs Immigrants Ambulatory Disability
COMPARE
Syrian
Immigrants
Ambulatory Disability
Ambulatory Disability Comparison
Syrians
Immigrants
6.0%
AMBULATORY DISABILITY
75.5/ 100
METRIC RATING
153rd/ 347
METRIC RANK
6.0%
AMBULATORY DISABILITY
86.9/ 100
METRIC RATING
133rd/ 347
METRIC RANK
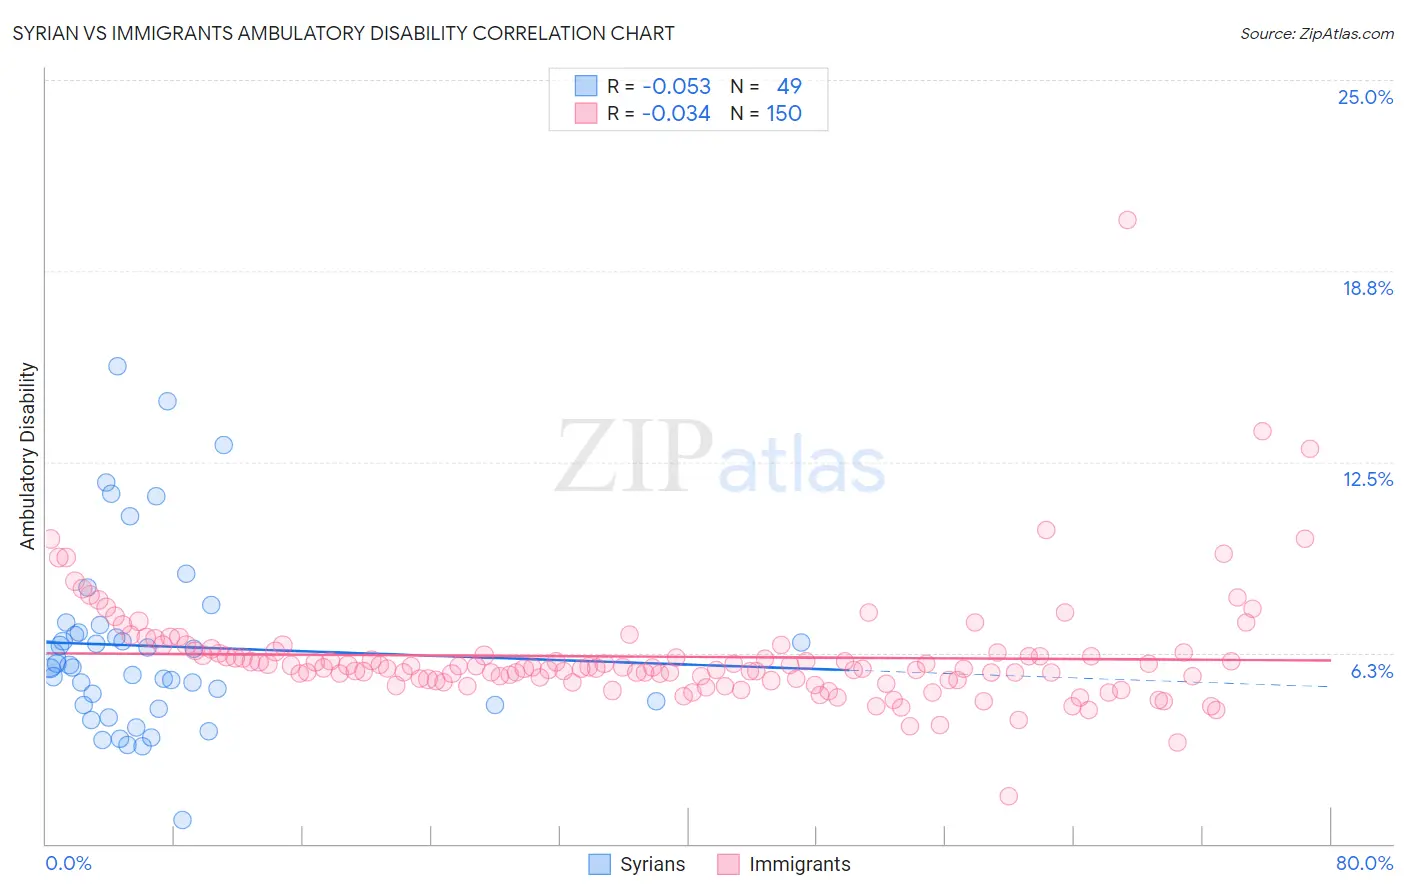
Syrian vs Immigrants Ambulatory Disability Correlation Chart
The statistical analysis conducted on geographies consisting of 266,278,347 people shows a slight negative correlation between the proportion of Syrians and percentage of population with ambulatory disability in the United States with a correlation coefficient (R) of -0.053 and weighted average of 6.0%. Similarly, the statistical analysis conducted on geographies consisting of 577,108,062 people shows no correlation between the proportion of Immigrants and percentage of population with ambulatory disability in the United States with a correlation coefficient (R) of -0.034 and weighted average of 6.0%, a difference of 1.0%.
Ambulatory Disability Correlation Summary
| Measurement | Syrian | Immigrants |
| Minimum | 0.77% | 1.6% |
| Maximum | 15.6% | 20.4% |
| Range | 14.8% | 18.8% |
| Mean | 6.5% | 6.1% |
| Median | 5.8% | 5.8% |
| Interquartile 25% (IQ1) | 4.5% | 5.4% |
| Interquartile 75% (IQ3) | 7.0% | 6.2% |
| Interquartile Range (IQR) | 2.5% | 0.89% |
| Standard Deviation (Sample) | 3.0% | 1.9% |
| Standard Deviation (Population) | 3.0% | 1.9% |
Demographics Similar to Syrians and Immigrants by Ambulatory Disability
In terms of ambulatory disability, the demographic groups most similar to Syrians are Immigrants from Austria (6.0%, a difference of 0.25%), Greek (6.0%, a difference of 0.32%), Maltese (6.0%, a difference of 0.50%), Lithuanian (6.0%, a difference of 0.52%), and Immigrants from Eastern Europe (6.0%, a difference of 0.53%). Similarly, the demographic groups most similar to Immigrants are Ute (6.0%, a difference of 0.040%), Immigrants from Italy (6.0%, a difference of 0.22%), Immigrants from North Macedonia (6.0%, a difference of 0.31%), Immigrants from Syria (6.0%, a difference of 0.31%), and Immigrants from Hungary (6.0%, a difference of 0.33%).
| Demographics | Rating | Rank | Ambulatory Disability |
| Immigrants | Immigrants | 86.9 /100 | #133 | Excellent 6.0% |
| Ute | 86.6 /100 | #134 | Excellent 6.0% |
| Immigrants | Italy | 85.0 /100 | #135 | Excellent 6.0% |
| Immigrants | North Macedonia | 84.1 /100 | #136 | Excellent 6.0% |
| Immigrants | Syria | 84.1 /100 | #137 | Excellent 6.0% |
| Immigrants | Hungary | 83.9 /100 | #138 | Excellent 6.0% |
| Immigrants | Zaire | 83.6 /100 | #139 | Excellent 6.0% |
| Czechs | 83.3 /100 | #140 | Excellent 6.0% |
| Swedes | 83.1 /100 | #141 | Excellent 6.0% |
| Immigrants | Philippines | 83.0 /100 | #142 | Excellent 6.0% |
| Romanians | 82.9 /100 | #143 | Excellent 6.0% |
| Macedonians | 82.8 /100 | #144 | Excellent 6.0% |
| Pakistanis | 82.5 /100 | #145 | Excellent 6.0% |
| Immigrants | Greece | 82.5 /100 | #146 | Excellent 6.0% |
| Immigrants | Moldova | 82.4 /100 | #147 | Excellent 6.0% |
| Immigrants | Eastern Europe | 82.0 /100 | #148 | Excellent 6.0% |
| Lithuanians | 81.9 /100 | #149 | Excellent 6.0% |
| Maltese | 81.6 /100 | #150 | Excellent 6.0% |
| Greeks | 79.6 /100 | #151 | Good 6.0% |
| Immigrants | Austria | 78.8 /100 | #152 | Good 6.0% |
| Syrians | 75.5 /100 | #153 | Good 6.0% |