Immigrants from Armenia vs Yakama Disability Age 18 to 34
COMPARE
Immigrants from Armenia
Yakama
Disability Age 18 to 34
Disability Age 18 to 34 Comparison
Immigrants from Armenia
Yakama
5.0%
DISABILITY AGE 18 TO 34
100.0/ 100
METRIC RATING
1st/ 347
METRIC RANK
9.0%
DISABILITY AGE 18 TO 34
0.0/ 100
METRIC RATING
342nd/ 347
METRIC RANK
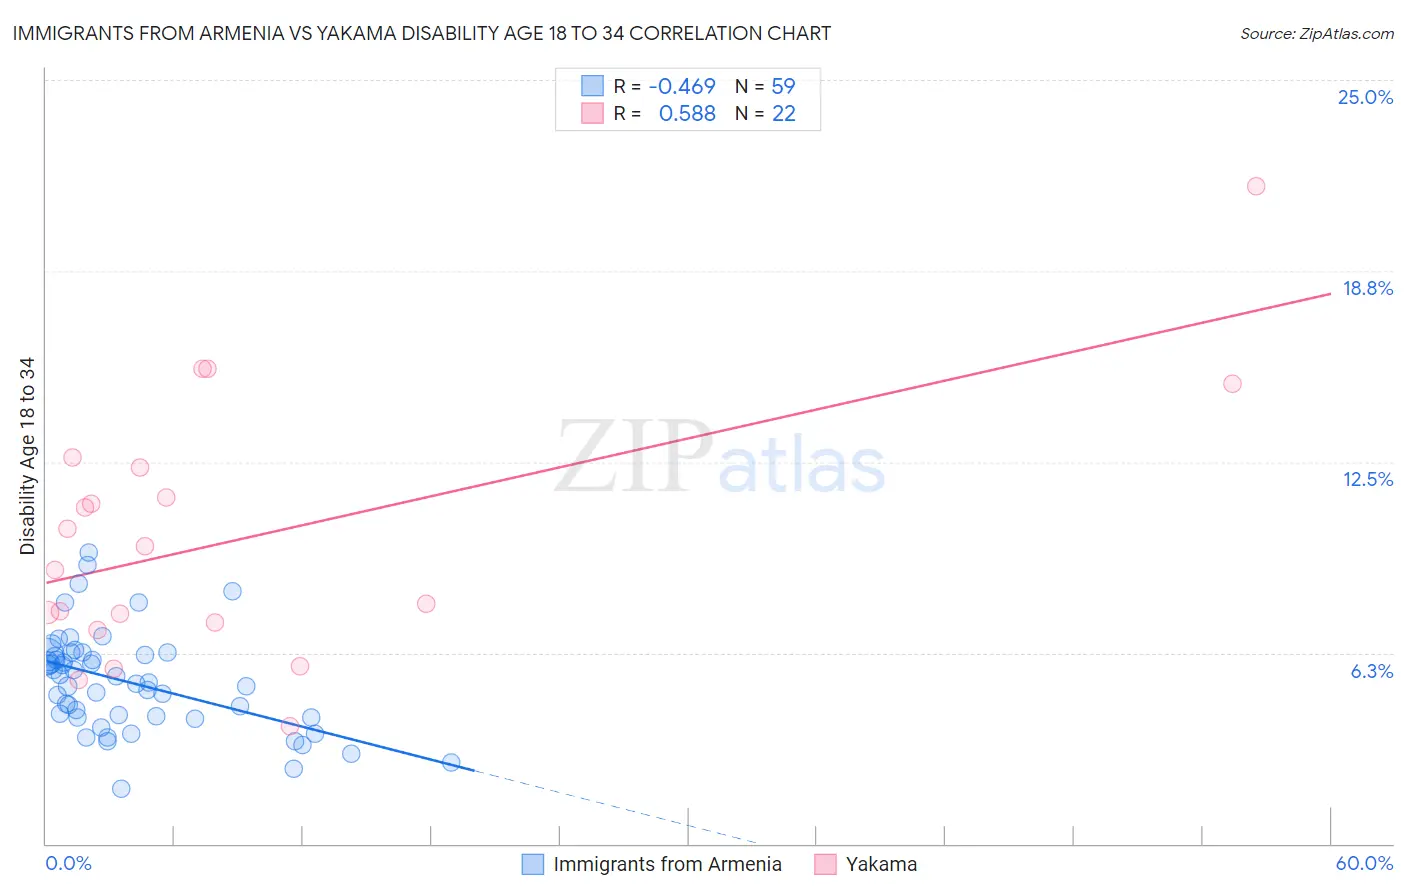
Immigrants from Armenia vs Yakama Disability Age 18 to 34 Correlation Chart
The statistical analysis conducted on geographies consisting of 97,601,753 people shows a moderate negative correlation between the proportion of Immigrants from Armenia and percentage of population with a disability between the ages 18 and 35 in the United States with a correlation coefficient (R) of -0.469 and weighted average of 5.0%. Similarly, the statistical analysis conducted on geographies consisting of 19,906,145 people shows a substantial positive correlation between the proportion of Yakama and percentage of population with a disability between the ages 18 and 35 in the United States with a correlation coefficient (R) of 0.588 and weighted average of 9.0%, a difference of 79.4%.
Disability Age 18 to 34 Correlation Summary
| Measurement | Immigrants from Armenia | Yakama |
| Minimum | 1.8% | 3.9% |
| Maximum | 9.5% | 21.5% |
| Range | 7.7% | 17.7% |
| Mean | 5.3% | 10.0% |
| Median | 5.3% | 9.3% |
| Interquartile 25% (IQ1) | 4.1% | 7.3% |
| Interquartile 75% (IQ3) | 6.2% | 12.3% |
| Interquartile Range (IQR) | 2.0% | 5.1% |
| Standard Deviation (Sample) | 1.6% | 4.2% |
| Standard Deviation (Population) | 1.6% | 4.1% |
Similar Demographics by Disability Age 18 to 34
Demographics Similar to Immigrants from Armenia by Disability Age 18 to 34
In terms of disability age 18 to 34, the demographic groups most similar to Immigrants from Armenia are Immigrants from Hong Kong (5.2%, a difference of 4.3%), Immigrants from Grenada (5.3%, a difference of 6.5%), Immigrants from Cuba (5.4%, a difference of 7.2%), Immigrants from Taiwan (5.4%, a difference of 7.5%), and Filipino (5.4%, a difference of 8.9%).
| Demographics | Rating | Rank | Disability Age 18 to 34 |
| Immigrants | Armenia | 100.0 /100 | #1 | Exceptional 5.0% |
| Immigrants | Hong Kong | 100.0 /100 | #2 | Exceptional 5.2% |
| Immigrants | Grenada | 100.0 /100 | #3 | Exceptional 5.3% |
| Immigrants | Cuba | 100.0 /100 | #4 | Exceptional 5.4% |
| Immigrants | Taiwan | 100.0 /100 | #5 | Exceptional 5.4% |
| Filipinos | 100.0 /100 | #6 | Exceptional 5.4% |
| Immigrants | China | 100.0 /100 | #7 | Exceptional 5.4% |
| Immigrants | Guyana | 100.0 /100 | #8 | Exceptional 5.5% |
| Guyanese | 100.0 /100 | #9 | Exceptional 5.5% |
| Immigrants | Uzbekistan | 100.0 /100 | #10 | Exceptional 5.5% |
| Vietnamese | 100.0 /100 | #11 | Exceptional 5.5% |
| Immigrants | St. Vincent and the Grenadines | 100.0 /100 | #12 | Exceptional 5.5% |
| Immigrants | Iran | 100.0 /100 | #13 | Exceptional 5.5% |
| Indians (Asian) | 100.0 /100 | #14 | Exceptional 5.5% |
| Immigrants | India | 100.0 /100 | #15 | Exceptional 5.6% |
Demographics Similar to Yakama by Disability Age 18 to 34
In terms of disability age 18 to 34, the demographic groups most similar to Yakama are Chippewa (9.0%, a difference of 0.010%), Chickasaw (9.0%, a difference of 0.050%), Choctaw (9.0%, a difference of 0.14%), Creek (9.0%, a difference of 0.39%), and Kiowa (8.8%, a difference of 1.6%).
| Demographics | Rating | Rank | Disability Age 18 to 34 |
| Apache | 0.0 /100 | #333 | Tragic 8.4% |
| Dutch West Indians | 0.0 /100 | #334 | Tragic 8.4% |
| Seminole | 0.0 /100 | #335 | Tragic 8.4% |
| Immigrants | Azores | 0.0 /100 | #336 | Tragic 8.5% |
| Ottawa | 0.0 /100 | #337 | Tragic 8.6% |
| Cherokee | 0.0 /100 | #338 | Tragic 8.7% |
| Kiowa | 0.0 /100 | #339 | Tragic 8.8% |
| Choctaw | 0.0 /100 | #340 | Tragic 9.0% |
| Chickasaw | 0.0 /100 | #341 | Tragic 9.0% |
| Yakama | 0.0 /100 | #342 | Tragic 9.0% |
| Chippewa | 0.0 /100 | #343 | Tragic 9.0% |
| Creek | 0.0 /100 | #344 | Tragic 9.0% |
| Alaskan Athabascans | 0.0 /100 | #345 | Tragic 9.4% |
| Houma | 0.0 /100 | #346 | Tragic 9.7% |
| Yuman | 0.0 /100 | #347 | Tragic 10.6% |