Cajun vs Yakama Disability Age 18 to 34
COMPARE
Cajun
Yakama
Disability Age 18 to 34
Disability Age 18 to 34 Comparison
Cajuns
Yakama
8.2%
DISABILITY AGE 18 TO 34
0.0/ 100
METRIC RATING
324th/ 347
METRIC RANK
9.0%
DISABILITY AGE 18 TO 34
0.0/ 100
METRIC RATING
342nd/ 347
METRIC RANK
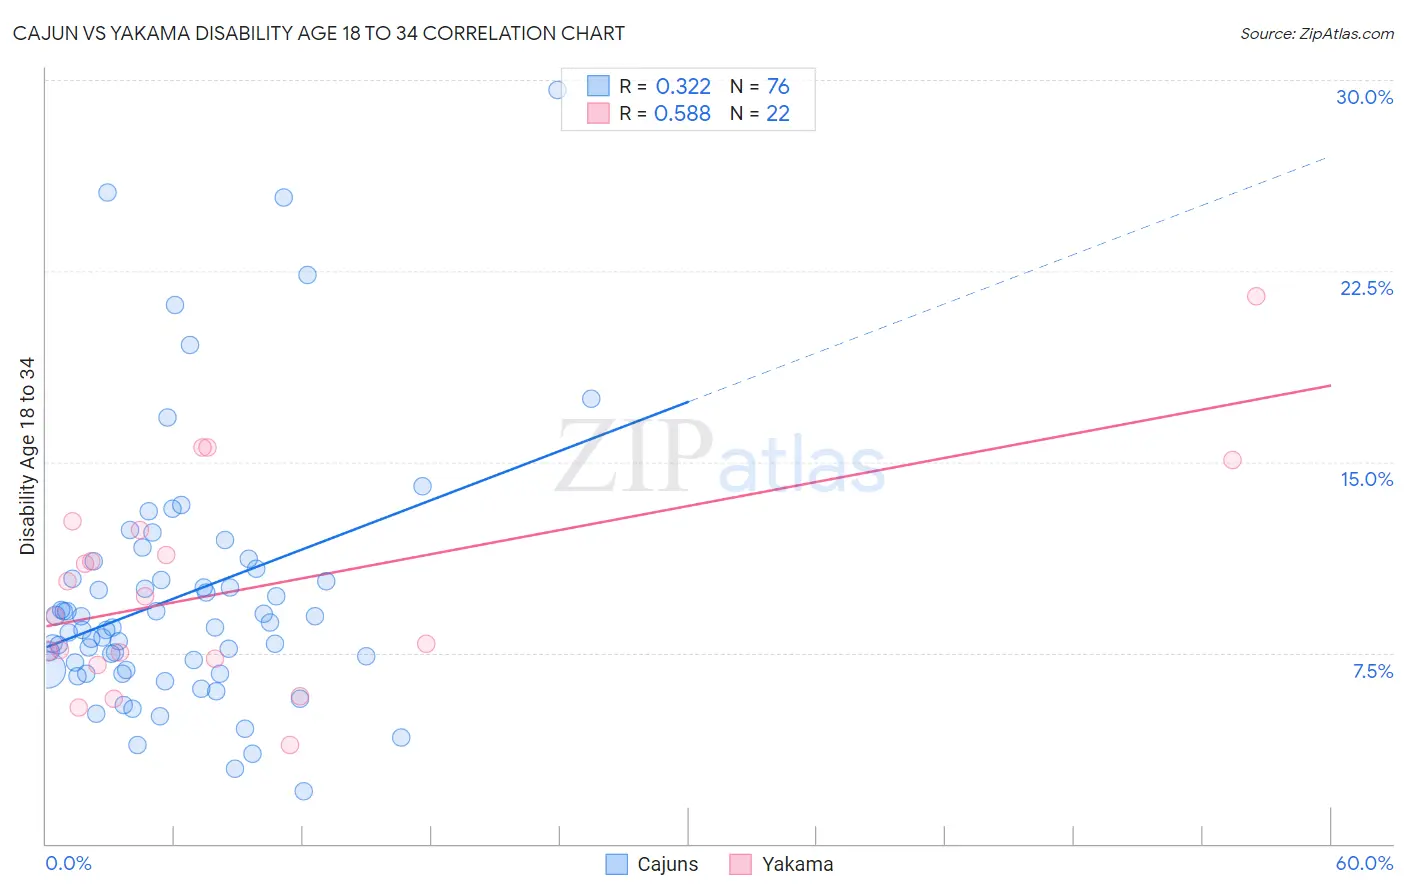
Cajun vs Yakama Disability Age 18 to 34 Correlation Chart
The statistical analysis conducted on geographies consisting of 149,523,864 people shows a mild positive correlation between the proportion of Cajuns and percentage of population with a disability between the ages 18 and 35 in the United States with a correlation coefficient (R) of 0.322 and weighted average of 8.2%. Similarly, the statistical analysis conducted on geographies consisting of 19,906,145 people shows a substantial positive correlation between the proportion of Yakama and percentage of population with a disability between the ages 18 and 35 in the United States with a correlation coefficient (R) of 0.588 and weighted average of 9.0%, a difference of 9.8%.
Disability Age 18 to 34 Correlation Summary
| Measurement | Cajun | Yakama |
| Minimum | 2.0% | 3.9% |
| Maximum | 29.6% | 21.5% |
| Range | 27.6% | 17.7% |
| Mean | 9.7% | 10.0% |
| Median | 8.5% | 9.3% |
| Interquartile 25% (IQ1) | 6.8% | 7.3% |
| Interquartile 75% (IQ3) | 10.6% | 12.3% |
| Interquartile Range (IQR) | 3.8% | 5.1% |
| Standard Deviation (Sample) | 5.1% | 4.2% |
| Standard Deviation (Population) | 5.1% | 4.1% |
Demographics Similar to Cajuns and Yakama by Disability Age 18 to 34
In terms of disability age 18 to 34, the demographic groups most similar to Cajuns are French American Indian (8.2%, a difference of 0.040%), Native/Alaskan (8.2%, a difference of 0.52%), Potawatomi (8.2%, a difference of 0.54%), Sioux (8.2%, a difference of 0.67%), and Delaware (8.2%, a difference of 0.71%). Similarly, the demographic groups most similar to Yakama are Chippewa (9.0%, a difference of 0.010%), Chickasaw (9.0%, a difference of 0.050%), Choctaw (9.0%, a difference of 0.14%), Kiowa (8.8%, a difference of 1.6%), and Cherokee (8.7%, a difference of 3.1%).
| Demographics | Rating | Rank | Disability Age 18 to 34 |
| French American Indians | 0.0 /100 | #323 | Tragic 8.2% |
| Cajuns | 0.0 /100 | #324 | Tragic 8.2% |
| Natives/Alaskans | 0.0 /100 | #325 | Tragic 8.2% |
| Potawatomi | 0.0 /100 | #326 | Tragic 8.2% |
| Sioux | 0.0 /100 | #327 | Tragic 8.2% |
| Delaware | 0.0 /100 | #328 | Tragic 8.2% |
| Crow | 0.0 /100 | #329 | Tragic 8.3% |
| Osage | 0.0 /100 | #330 | Tragic 8.3% |
| Comanche | 0.0 /100 | #331 | Tragic 8.3% |
| Puget Sound Salish | 0.0 /100 | #332 | Tragic 8.3% |
| Apache | 0.0 /100 | #333 | Tragic 8.4% |
| Dutch West Indians | 0.0 /100 | #334 | Tragic 8.4% |
| Seminole | 0.0 /100 | #335 | Tragic 8.4% |
| Immigrants | Azores | 0.0 /100 | #336 | Tragic 8.5% |
| Ottawa | 0.0 /100 | #337 | Tragic 8.6% |
| Cherokee | 0.0 /100 | #338 | Tragic 8.7% |
| Kiowa | 0.0 /100 | #339 | Tragic 8.8% |
| Choctaw | 0.0 /100 | #340 | Tragic 9.0% |
| Chickasaw | 0.0 /100 | #341 | Tragic 9.0% |
| Yakama | 0.0 /100 | #342 | Tragic 9.0% |
| Chippewa | 0.0 /100 | #343 | Tragic 9.0% |