White/Caucasian vs Uruguayan Cognitive Disability
COMPARE
White/Caucasian
Uruguayan
Cognitive Disability
Cognitive Disability Comparison
Whites/Caucasians
Uruguayans
17.0%
COGNITIVE DISABILITY
92.1/ 100
METRIC RATING
132nd/ 347
METRIC RANK
16.8%
COGNITIVE DISABILITY
97.2/ 100
METRIC RATING
111th/ 347
METRIC RANK
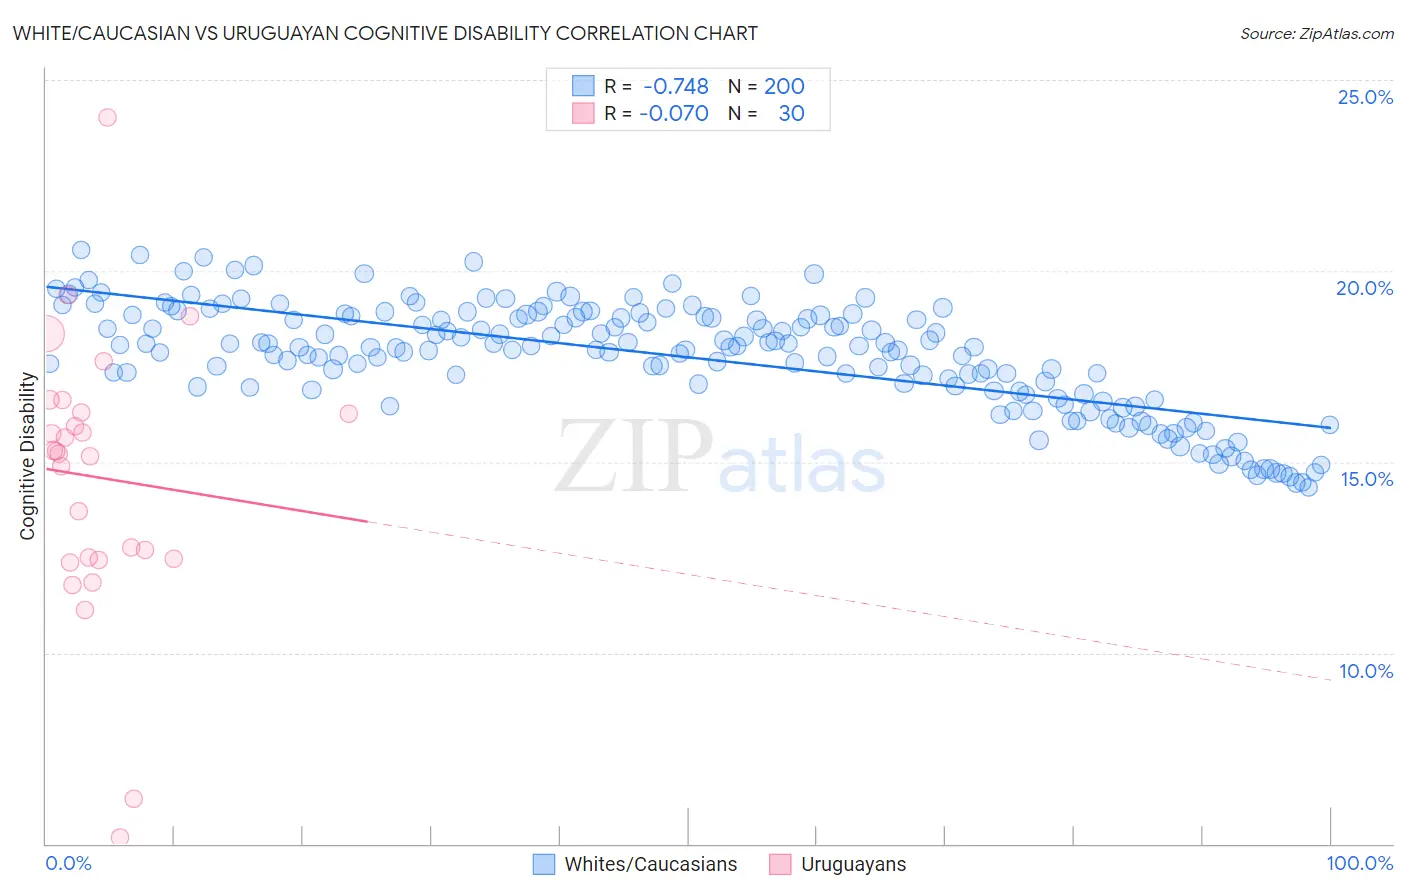
White/Caucasian vs Uruguayan Cognitive Disability Correlation Chart
The statistical analysis conducted on geographies consisting of 584,856,433 people shows a strong negative correlation between the proportion of Whites/Caucasians and percentage of population with cognitive disability in the United States with a correlation coefficient (R) of -0.748 and weighted average of 17.0%. Similarly, the statistical analysis conducted on geographies consisting of 144,784,951 people shows a slight negative correlation between the proportion of Uruguayans and percentage of population with cognitive disability in the United States with a correlation coefficient (R) of -0.070 and weighted average of 16.8%, a difference of 0.80%.
Cognitive Disability Correlation Summary
| Measurement | White/Caucasian | Uruguayan |
| Minimum | 14.3% | 5.2% |
| Maximum | 20.5% | 24.0% |
| Range | 6.2% | 18.9% |
| Mean | 17.7% | 14.6% |
| Median | 18.0% | 15.2% |
| Interquartile 25% (IQ1) | 16.9% | 12.5% |
| Interquartile 75% (IQ3) | 18.8% | 16.3% |
| Interquartile Range (IQR) | 1.9% | 3.8% |
| Standard Deviation (Sample) | 1.4% | 3.7% |
| Standard Deviation (Population) | 1.4% | 3.6% |
Similar Demographics by Cognitive Disability
Demographics Similar to Whites/Caucasians by Cognitive Disability
In terms of cognitive disability, the demographic groups most similar to Whites/Caucasians are Immigrants from Germany (17.0%, a difference of 0.0%), Immigrants from Vietnam (17.0%, a difference of 0.020%), Immigrants from Jordan (17.0%, a difference of 0.030%), Immigrants from Chile (17.0%, a difference of 0.040%), and Immigrants from Uruguay (17.0%, a difference of 0.080%).
| Demographics | Rating | Rank | Cognitive Disability |
| Scandinavians | 94.1 /100 | #125 | Exceptional 16.9% |
| Europeans | 93.4 /100 | #126 | Exceptional 17.0% |
| Immigrants | Costa Rica | 93.1 /100 | #127 | Exceptional 17.0% |
| Nicaraguans | 93.0 /100 | #128 | Exceptional 17.0% |
| Immigrants | Uruguay | 92.9 /100 | #129 | Exceptional 17.0% |
| Immigrants | Vietnam | 92.4 /100 | #130 | Exceptional 17.0% |
| Immigrants | Germany | 92.1 /100 | #131 | Exceptional 17.0% |
| Whites/Caucasians | 92.1 /100 | #132 | Exceptional 17.0% |
| Immigrants | Jordan | 91.9 /100 | #133 | Exceptional 17.0% |
| Immigrants | Chile | 91.7 /100 | #134 | Exceptional 17.0% |
| Lebanese | 91.3 /100 | #135 | Exceptional 17.0% |
| Israelis | 91.0 /100 | #136 | Exceptional 17.0% |
| Immigrants | Norway | 90.9 /100 | #137 | Exceptional 17.0% |
| Welsh | 90.8 /100 | #138 | Exceptional 17.0% |
| French | 90.0 /100 | #139 | Excellent 17.0% |
Demographics Similar to Uruguayans by Cognitive Disability
In terms of cognitive disability, the demographic groups most similar to Uruguayans are Arapaho (16.8%, a difference of 0.010%), Albanian (16.8%, a difference of 0.020%), Indian (Asian) (16.8%, a difference of 0.020%), Immigrants from Sri Lanka (16.8%, a difference of 0.030%), and Korean (16.8%, a difference of 0.030%).
| Demographics | Rating | Rank | Cognitive Disability |
| Palestinians | 98.0 /100 | #104 | Exceptional 16.8% |
| Immigrants | Eastern Asia | 97.9 /100 | #105 | Exceptional 16.8% |
| Northern Europeans | 97.8 /100 | #106 | Exceptional 16.8% |
| Immigrants | Nicaragua | 97.8 /100 | #107 | Exceptional 16.8% |
| Canadians | 97.5 /100 | #108 | Exceptional 16.8% |
| Albanians | 97.3 /100 | #109 | Exceptional 16.8% |
| Arapaho | 97.3 /100 | #110 | Exceptional 16.8% |
| Uruguayans | 97.2 /100 | #111 | Exceptional 16.8% |
| Indians (Asian) | 97.2 /100 | #112 | Exceptional 16.8% |
| Immigrants | Sri Lanka | 97.1 /100 | #113 | Exceptional 16.8% |
| Koreans | 97.1 /100 | #114 | Exceptional 16.8% |
| Yup'ik | 96.9 /100 | #115 | Exceptional 16.9% |
| Inupiat | 96.5 /100 | #116 | Exceptional 16.9% |
| Immigrants | Japan | 96.2 /100 | #117 | Exceptional 16.9% |
| Immigrants | Denmark | 96.2 /100 | #118 | Exceptional 16.9% |