Immigrants from Uganda vs Turkish Self-Care Disability
COMPARE
Immigrants from Uganda
Turkish
Self-Care Disability
Self-Care Disability Comparison
Immigrants from Uganda
Turks
2.3%
SELF-CARE DISABILITY
99.8/ 100
METRIC RATING
42nd/ 347
METRIC RANK
2.2%
SELF-CARE DISABILITY
100.0/ 100
METRIC RATING
25th/ 347
METRIC RANK
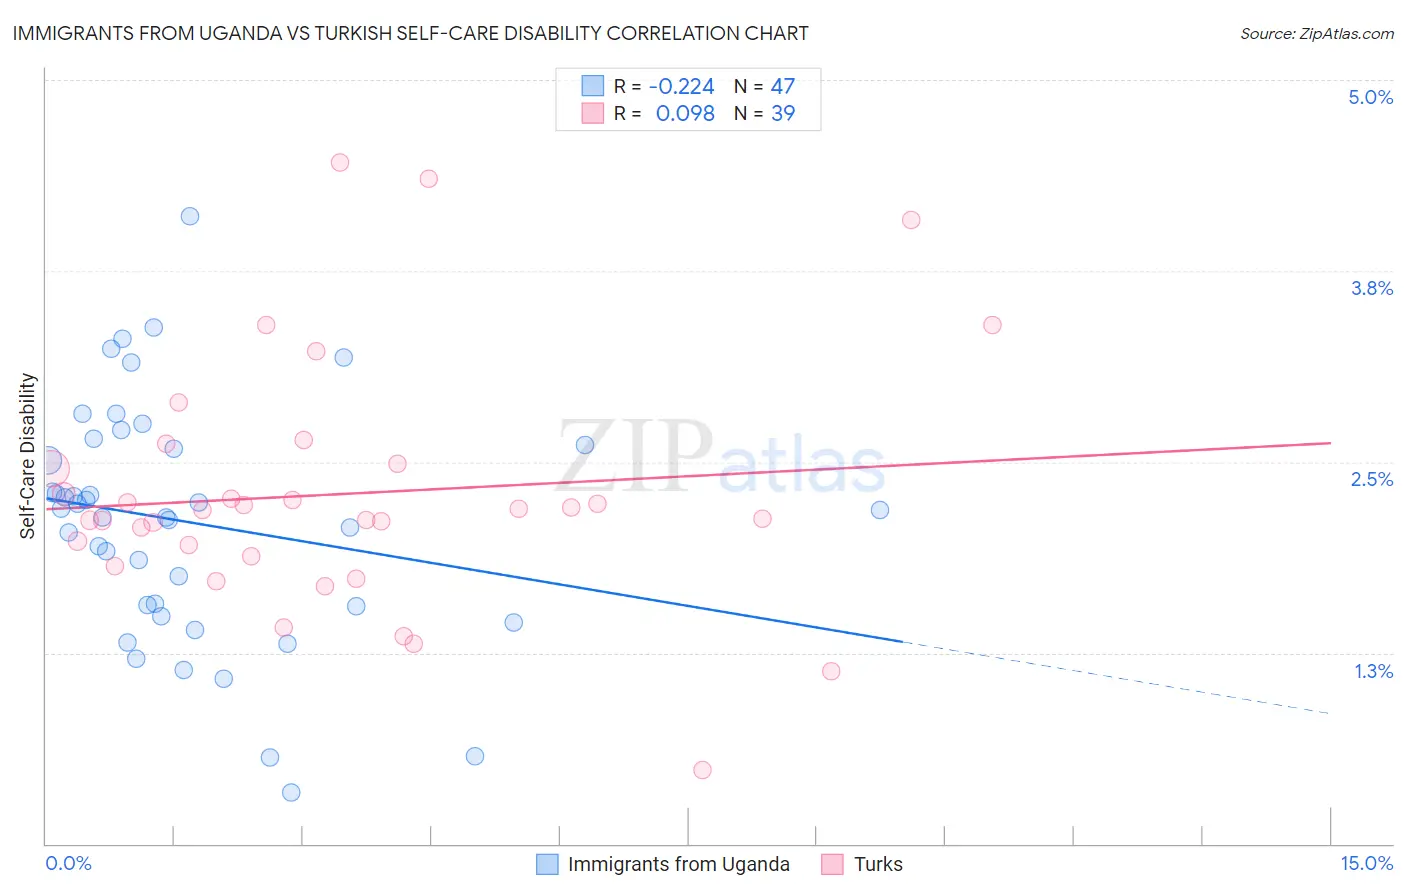
Immigrants from Uganda vs Turkish Self-Care Disability Correlation Chart
The statistical analysis conducted on geographies consisting of 125,933,706 people shows a weak negative correlation between the proportion of Immigrants from Uganda and percentage of population with self-care disability in the United States with a correlation coefficient (R) of -0.224 and weighted average of 2.3%. Similarly, the statistical analysis conducted on geographies consisting of 271,627,212 people shows a slight positive correlation between the proportion of Turks and percentage of population with self-care disability in the United States with a correlation coefficient (R) of 0.098 and weighted average of 2.2%, a difference of 1.7%.
Self-Care Disability Correlation Summary
| Measurement | Immigrants from Uganda | Turkish |
| Minimum | 0.33% | 0.49% |
| Maximum | 4.1% | 4.5% |
| Range | 3.8% | 4.0% |
| Mean | 2.1% | 2.3% |
| Median | 2.2% | 2.2% |
| Interquartile 25% (IQ1) | 1.6% | 1.9% |
| Interquartile 75% (IQ3) | 2.6% | 2.5% |
| Interquartile Range (IQR) | 1.1% | 0.61% |
| Standard Deviation (Sample) | 0.78% | 0.81% |
| Standard Deviation (Population) | 0.77% | 0.80% |
Demographics Similar to Immigrants from Uganda and Turks by Self-Care Disability
In terms of self-care disability, the demographic groups most similar to Immigrants from Uganda are Immigrants from Pakistan (2.3%, a difference of 0.050%), Immigrants from Sudan (2.3%, a difference of 0.10%), Iranian (2.3%, a difference of 0.17%), Immigrants from Bulgaria (2.3%, a difference of 0.21%), and Immigrants from Eastern Africa (2.3%, a difference of 0.32%). Similarly, the demographic groups most similar to Turks are Immigrants from Sri Lanka (2.2%, a difference of 0.070%), Venezuelan (2.2%, a difference of 0.080%), Cypriot (2.2%, a difference of 0.11%), Inupiat (2.2%, a difference of 0.24%), and Immigrants from Zimbabwe (2.3%, a difference of 0.33%).
| Demographics | Rating | Rank | Self-Care Disability |
| Cambodians | 100.0 /100 | #23 | Exceptional 2.2% |
| Cypriots | 100.0 /100 | #24 | Exceptional 2.2% |
| Turks | 100.0 /100 | #25 | Exceptional 2.2% |
| Immigrants | Sri Lanka | 99.9 /100 | #26 | Exceptional 2.2% |
| Venezuelans | 99.9 /100 | #27 | Exceptional 2.2% |
| Inupiat | 99.9 /100 | #28 | Exceptional 2.2% |
| Immigrants | Zimbabwe | 99.9 /100 | #29 | Exceptional 2.3% |
| Paraguayans | 99.9 /100 | #30 | Exceptional 2.3% |
| Danes | 99.9 /100 | #31 | Exceptional 2.3% |
| Burmese | 99.9 /100 | #32 | Exceptional 2.3% |
| Immigrants | Korea | 99.9 /100 | #33 | Exceptional 2.3% |
| Immigrants | Turkey | 99.9 /100 | #34 | Exceptional 2.3% |
| Immigrants | Australia | 99.9 /100 | #35 | Exceptional 2.3% |
| Immigrants | Lithuania | 99.9 /100 | #36 | Exceptional 2.3% |
| Immigrants | Sweden | 99.9 /100 | #37 | Exceptional 2.3% |
| Immigrants | Eastern Africa | 99.9 /100 | #38 | Exceptional 2.3% |
| Immigrants | Bulgaria | 99.8 /100 | #39 | Exceptional 2.3% |
| Iranians | 99.8 /100 | #40 | Exceptional 2.3% |
| Immigrants | Sudan | 99.8 /100 | #41 | Exceptional 2.3% |
| Immigrants | Uganda | 99.8 /100 | #42 | Exceptional 2.3% |
| Immigrants | Pakistan | 99.8 /100 | #43 | Exceptional 2.3% |