Iraqi vs Marshallese Disability Age Over 75
COMPARE
Iraqi
Marshallese
Disability Age Over 75
Disability Age Over 75 Comparison
Iraqis
Marshallese
48.6%
DISABILITY AGE OVER 75
1.0/ 100
METRIC RATING
249th/ 347
METRIC RANK
50.1%
DISABILITY AGE OVER 75
0.0/ 100
METRIC RATING
298th/ 347
METRIC RANK
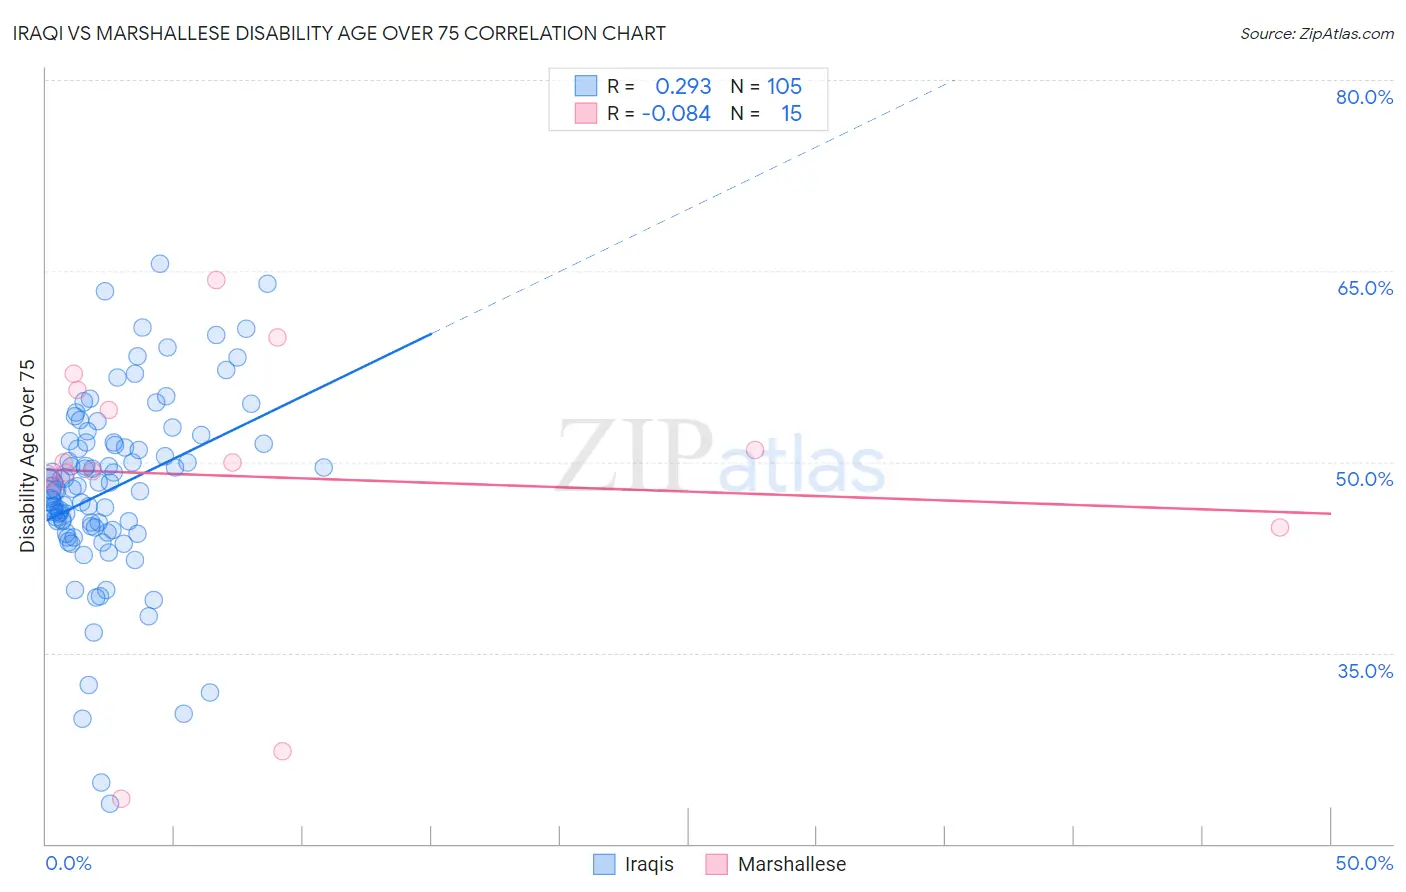
Iraqi vs Marshallese Disability Age Over 75 Correlation Chart
The statistical analysis conducted on geographies consisting of 170,579,857 people shows a weak positive correlation between the proportion of Iraqis and percentage of population with a disability over the age of 75 in the United States with a correlation coefficient (R) of 0.293 and weighted average of 48.6%. Similarly, the statistical analysis conducted on geographies consisting of 14,759,035 people shows a slight negative correlation between the proportion of Marshallese and percentage of population with a disability over the age of 75 in the United States with a correlation coefficient (R) of -0.084 and weighted average of 50.1%, a difference of 3.1%.
Disability Age Over 75 Correlation Summary
| Measurement | Iraqi | Marshallese |
| Minimum | 23.1% | 23.5% |
| Maximum | 65.6% | 64.3% |
| Range | 42.5% | 40.8% |
| Mean | 47.8% | 48.9% |
| Median | 48.0% | 49.9% |
| Interquartile 25% (IQ1) | 44.8% | 48.2% |
| Interquartile 75% (IQ3) | 51.5% | 55.7% |
| Interquartile Range (IQR) | 6.8% | 7.5% |
| Standard Deviation (Sample) | 7.3% | 10.8% |
| Standard Deviation (Population) | 7.3% | 10.4% |
Similar Demographics by Disability Age Over 75
Demographics Similar to Iraqis by Disability Age Over 75
In terms of disability age over 75, the demographic groups most similar to Iraqis are West Indian (48.6%, a difference of 0.080%), Korean (48.6%, a difference of 0.10%), Immigrants from South Eastern Asia (48.7%, a difference of 0.20%), Sri Lankan (48.5%, a difference of 0.21%), and British West Indian (48.7%, a difference of 0.25%).
| Demographics | Rating | Rank | Disability Age Over 75 |
| French American Indians | 2.2 /100 | #242 | Tragic 48.3% |
| Immigrants | Caribbean | 2.1 /100 | #243 | Tragic 48.4% |
| Afghans | 1.8 /100 | #244 | Tragic 48.4% |
| Americans | 1.7 /100 | #245 | Tragic 48.4% |
| Chippewa | 1.6 /100 | #246 | Tragic 48.4% |
| Iroquois | 1.6 /100 | #247 | Tragic 48.4% |
| Sri Lankans | 1.4 /100 | #248 | Tragic 48.5% |
| Iraqis | 1.0 /100 | #249 | Tragic 48.6% |
| West Indians | 0.8 /100 | #250 | Tragic 48.6% |
| Koreans | 0.8 /100 | #251 | Tragic 48.6% |
| Immigrants | South Eastern Asia | 0.7 /100 | #252 | Tragic 48.7% |
| British West Indians | 0.6 /100 | #253 | Tragic 48.7% |
| Immigrants | Vietnam | 0.6 /100 | #254 | Tragic 48.7% |
| Chinese | 0.5 /100 | #255 | Tragic 48.7% |
| Immigrants | Congo | 0.5 /100 | #256 | Tragic 48.7% |
Demographics Similar to Marshallese by Disability Age Over 75
In terms of disability age over 75, the demographic groups most similar to Marshallese are Armenian (50.0%, a difference of 0.050%), Immigrants from Micronesia (50.1%, a difference of 0.070%), Mexican American Indian (50.0%, a difference of 0.080%), Cape Verdean (50.1%, a difference of 0.10%), and Spanish American (50.0%, a difference of 0.12%).
| Demographics | Rating | Rank | Disability Age Over 75 |
| Arapaho | 0.0 /100 | #291 | Tragic 49.8% |
| Shoshone | 0.0 /100 | #292 | Tragic 49.9% |
| Spanish American Indians | 0.0 /100 | #293 | Tragic 49.9% |
| Immigrants | Cambodia | 0.0 /100 | #294 | Tragic 50.0% |
| Spanish Americans | 0.0 /100 | #295 | Tragic 50.0% |
| Mexican American Indians | 0.0 /100 | #296 | Tragic 50.0% |
| Armenians | 0.0 /100 | #297 | Tragic 50.0% |
| Marshallese | 0.0 /100 | #298 | Tragic 50.1% |
| Immigrants | Micronesia | 0.0 /100 | #299 | Tragic 50.1% |
| Cape Verdeans | 0.0 /100 | #300 | Tragic 50.1% |
| Dominicans | 0.0 /100 | #301 | Tragic 50.2% |
| Cherokee | 0.0 /100 | #302 | Tragic 50.2% |
| Japanese | 0.0 /100 | #303 | Tragic 50.2% |
| Immigrants | Dominican Republic | 0.0 /100 | #304 | Tragic 50.3% |
| Central American Indians | 0.0 /100 | #305 | Tragic 50.5% |