Immigrants from Mexico vs Marshallese Disability Age Over 75
COMPARE
Immigrants from Mexico
Marshallese
Disability Age Over 75
Disability Age Over 75 Comparison
Immigrants from Mexico
Marshallese
51.1%
DISABILITY AGE OVER 75
0.0/ 100
METRIC RATING
314th/ 347
METRIC RANK
50.1%
DISABILITY AGE OVER 75
0.0/ 100
METRIC RATING
298th/ 347
METRIC RANK
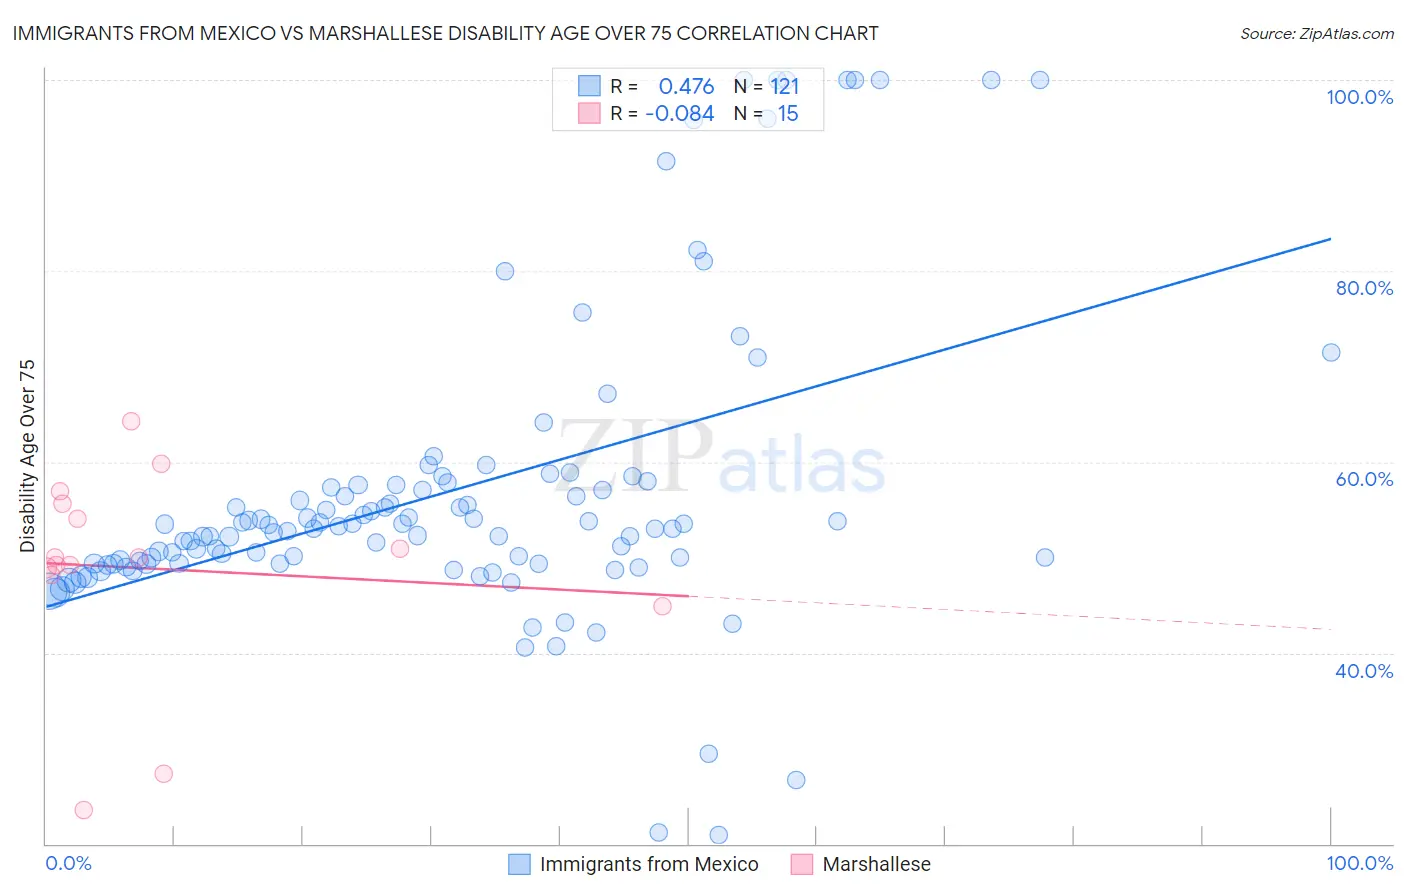
Immigrants from Mexico vs Marshallese Disability Age Over 75 Correlation Chart
The statistical analysis conducted on geographies consisting of 512,333,705 people shows a moderate positive correlation between the proportion of Immigrants from Mexico and percentage of population with a disability over the age of 75 in the United States with a correlation coefficient (R) of 0.476 and weighted average of 51.1%. Similarly, the statistical analysis conducted on geographies consisting of 14,759,035 people shows a slight negative correlation between the proportion of Marshallese and percentage of population with a disability over the age of 75 in the United States with a correlation coefficient (R) of -0.084 and weighted average of 50.1%, a difference of 2.1%.
Disability Age Over 75 Correlation Summary
| Measurement | Immigrants from Mexico | Marshallese |
| Minimum | 20.9% | 23.5% |
| Maximum | 100.0% | 64.3% |
| Range | 79.1% | 40.8% |
| Mean | 56.9% | 48.9% |
| Median | 53.0% | 49.9% |
| Interquartile 25% (IQ1) | 49.3% | 48.2% |
| Interquartile 75% (IQ3) | 57.6% | 55.7% |
| Interquartile Range (IQR) | 8.2% | 7.5% |
| Standard Deviation (Sample) | 15.9% | 10.8% |
| Standard Deviation (Population) | 15.9% | 10.4% |
Demographics Similar to Immigrants from Mexico and Marshallese by Disability Age Over 75
In terms of disability age over 75, the demographic groups most similar to Immigrants from Mexico are Mexican (51.1%, a difference of 0.050%), Chickasaw (51.2%, a difference of 0.19%), Immigrants from the Azores (50.9%, a difference of 0.37%), Cheyenne (50.9%, a difference of 0.42%), and Cajun (50.7%, a difference of 0.88%). Similarly, the demographic groups most similar to Marshallese are Armenian (50.0%, a difference of 0.050%), Immigrants from Micronesia (50.1%, a difference of 0.070%), Mexican American Indian (50.0%, a difference of 0.080%), Cape Verdean (50.1%, a difference of 0.10%), and Dominican (50.2%, a difference of 0.16%).
| Demographics | Rating | Rank | Disability Age Over 75 |
| Mexican American Indians | 0.0 /100 | #296 | Tragic 50.0% |
| Armenians | 0.0 /100 | #297 | Tragic 50.0% |
| Marshallese | 0.0 /100 | #298 | Tragic 50.1% |
| Immigrants | Micronesia | 0.0 /100 | #299 | Tragic 50.1% |
| Cape Verdeans | 0.0 /100 | #300 | Tragic 50.1% |
| Dominicans | 0.0 /100 | #301 | Tragic 50.2% |
| Cherokee | 0.0 /100 | #302 | Tragic 50.2% |
| Japanese | 0.0 /100 | #303 | Tragic 50.2% |
| Immigrants | Dominican Republic | 0.0 /100 | #304 | Tragic 50.3% |
| Central American Indians | 0.0 /100 | #305 | Tragic 50.5% |
| Immigrants | Central America | 0.0 /100 | #306 | Tragic 50.5% |
| Immigrants | Fiji | 0.0 /100 | #307 | Tragic 50.6% |
| Hispanics or Latinos | 0.0 /100 | #308 | Tragic 50.6% |
| Aleuts | 0.0 /100 | #309 | Tragic 50.6% |
| Tlingit-Haida | 0.0 /100 | #310 | Tragic 50.6% |
| Cajuns | 0.0 /100 | #311 | Tragic 50.7% |
| Cheyenne | 0.0 /100 | #312 | Tragic 50.9% |
| Immigrants | Azores | 0.0 /100 | #313 | Tragic 50.9% |
| Immigrants | Mexico | 0.0 /100 | #314 | Tragic 51.1% |
| Mexicans | 0.0 /100 | #315 | Tragic 51.1% |
| Chickasaw | 0.0 /100 | #316 | Tragic 51.2% |