Immigrants from Latin America vs Immigrants from Portugal Disability Age Over 75
COMPARE
Immigrants from Latin America
Immigrants from Portugal
Disability Age Over 75
Disability Age Over 75 Comparison
Immigrants from Latin America
Immigrants from Portugal
49.5%
DISABILITY AGE OVER 75
0.0/ 100
METRIC RATING
284th/ 347
METRIC RANK
47.6%
DISABILITY AGE OVER 75
23.8/ 100
METRIC RATING
196th/ 347
METRIC RANK
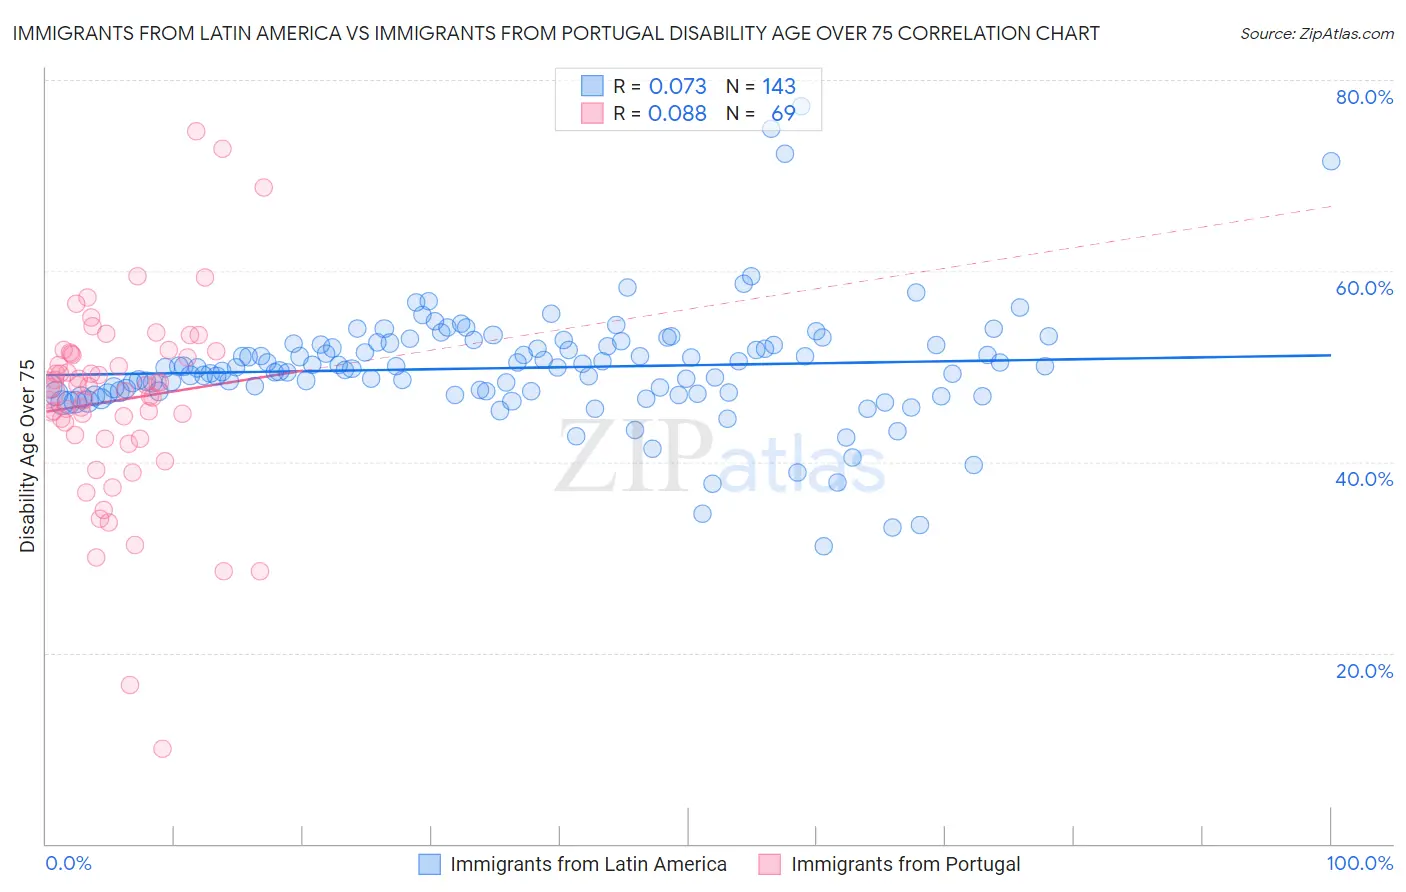
Immigrants from Latin America vs Immigrants from Portugal Disability Age Over 75 Correlation Chart
The statistical analysis conducted on geographies consisting of 556,620,542 people shows a slight positive correlation between the proportion of Immigrants from Latin America and percentage of population with a disability over the age of 75 in the United States with a correlation coefficient (R) of 0.073 and weighted average of 49.5%. Similarly, the statistical analysis conducted on geographies consisting of 174,707,158 people shows a slight positive correlation between the proportion of Immigrants from Portugal and percentage of population with a disability over the age of 75 in the United States with a correlation coefficient (R) of 0.088 and weighted average of 47.6%, a difference of 4.0%.
Disability Age Over 75 Correlation Summary
| Measurement | Immigrants from Latin America | Immigrants from Portugal |
| Minimum | 31.1% | 10.0% |
| Maximum | 77.2% | 74.7% |
| Range | 46.1% | 64.7% |
| Mean | 49.8% | 46.5% |
| Median | 49.8% | 47.7% |
| Interquartile 25% (IQ1) | 47.2% | 42.6% |
| Interquartile 75% (IQ3) | 52.3% | 51.4% |
| Interquartile Range (IQR) | 5.1% | 8.8% |
| Standard Deviation (Sample) | 6.3% | 10.4% |
| Standard Deviation (Population) | 6.2% | 10.3% |
Similar Demographics by Disability Age Over 75
Demographics Similar to Immigrants from Latin America by Disability Age Over 75
In terms of disability age over 75, the demographic groups most similar to Immigrants from Latin America are Samoan (49.5%, a difference of 0.050%), Black/African American (49.5%, a difference of 0.080%), Crow (49.6%, a difference of 0.13%), Belizean (49.4%, a difference of 0.22%), and Immigrants from Belize (49.6%, a difference of 0.22%).
| Demographics | Rating | Rank | Disability Age Over 75 |
| Hawaiians | 0.1 /100 | #277 | Tragic 49.2% |
| Immigrants | Laos | 0.1 /100 | #278 | Tragic 49.2% |
| Guamanians/Chamorros | 0.0 /100 | #279 | Tragic 49.4% |
| Bangladeshis | 0.0 /100 | #280 | Tragic 49.4% |
| Belizeans | 0.0 /100 | #281 | Tragic 49.4% |
| Blacks/African Americans | 0.0 /100 | #282 | Tragic 49.5% |
| Samoans | 0.0 /100 | #283 | Tragic 49.5% |
| Immigrants | Latin America | 0.0 /100 | #284 | Tragic 49.5% |
| Crow | 0.0 /100 | #285 | Tragic 49.6% |
| Immigrants | Belize | 0.0 /100 | #286 | Tragic 49.6% |
| Sioux | 0.0 /100 | #287 | Tragic 49.7% |
| Yaqui | 0.0 /100 | #288 | Tragic 49.8% |
| Osage | 0.0 /100 | #289 | Tragic 49.8% |
| Puget Sound Salish | 0.0 /100 | #290 | Tragic 49.8% |
| Arapaho | 0.0 /100 | #291 | Tragic 49.8% |
Demographics Similar to Immigrants from Portugal by Disability Age Over 75
In terms of disability age over 75, the demographic groups most similar to Immigrants from Portugal are Pakistani (47.7%, a difference of 0.010%), Immigrants from Ukraine (47.7%, a difference of 0.020%), Immigrants from Eritrea (47.7%, a difference of 0.040%), Immigrants from Trinidad and Tobago (47.6%, a difference of 0.050%), and Immigrants from Lebanon (47.6%, a difference of 0.080%).
| Demographics | Rating | Rank | Disability Age Over 75 |
| Immigrants | Kenya | 30.8 /100 | #189 | Fair 47.6% |
| Somalis | 29.5 /100 | #190 | Fair 47.6% |
| Portuguese | 29.3 /100 | #191 | Fair 47.6% |
| Immigrants | Jamaica | 28.3 /100 | #192 | Fair 47.6% |
| Ottawa | 28.1 /100 | #193 | Fair 47.6% |
| Immigrants | Lebanon | 26.5 /100 | #194 | Fair 47.6% |
| Immigrants | Trinidad and Tobago | 25.3 /100 | #195 | Fair 47.6% |
| Immigrants | Portugal | 23.8 /100 | #196 | Fair 47.6% |
| Pakistanis | 23.4 /100 | #197 | Fair 47.7% |
| Immigrants | Ukraine | 23.2 /100 | #198 | Fair 47.7% |
| Immigrants | Eritrea | 22.4 /100 | #199 | Fair 47.7% |
| Immigrants | Somalia | 21.4 /100 | #200 | Fair 47.7% |
| Immigrants | Cuba | 20.9 /100 | #201 | Fair 47.7% |
| Immigrants | Bahamas | 20.7 /100 | #202 | Fair 47.7% |
| Trinidadians and Tobagonians | 20.0 /100 | #203 | Fair 47.7% |