White/Caucasian vs Immigrants from Portugal Child Poverty Under the Age of 16
COMPARE
White/Caucasian
Immigrants from Portugal
Child Poverty Under the Age of 16
Child Poverty Under the Age of 16 Comparison
Whites/Caucasians
Immigrants from Portugal
16.2%
CHILD POVERTY UNDER THE AGE OF 16
50.0/ 100
METRIC RATING
174th/ 347
METRIC RANK
16.6%
CHILD POVERTY UNDER THE AGE OF 16
30.0/ 100
METRIC RATING
189th/ 347
METRIC RANK
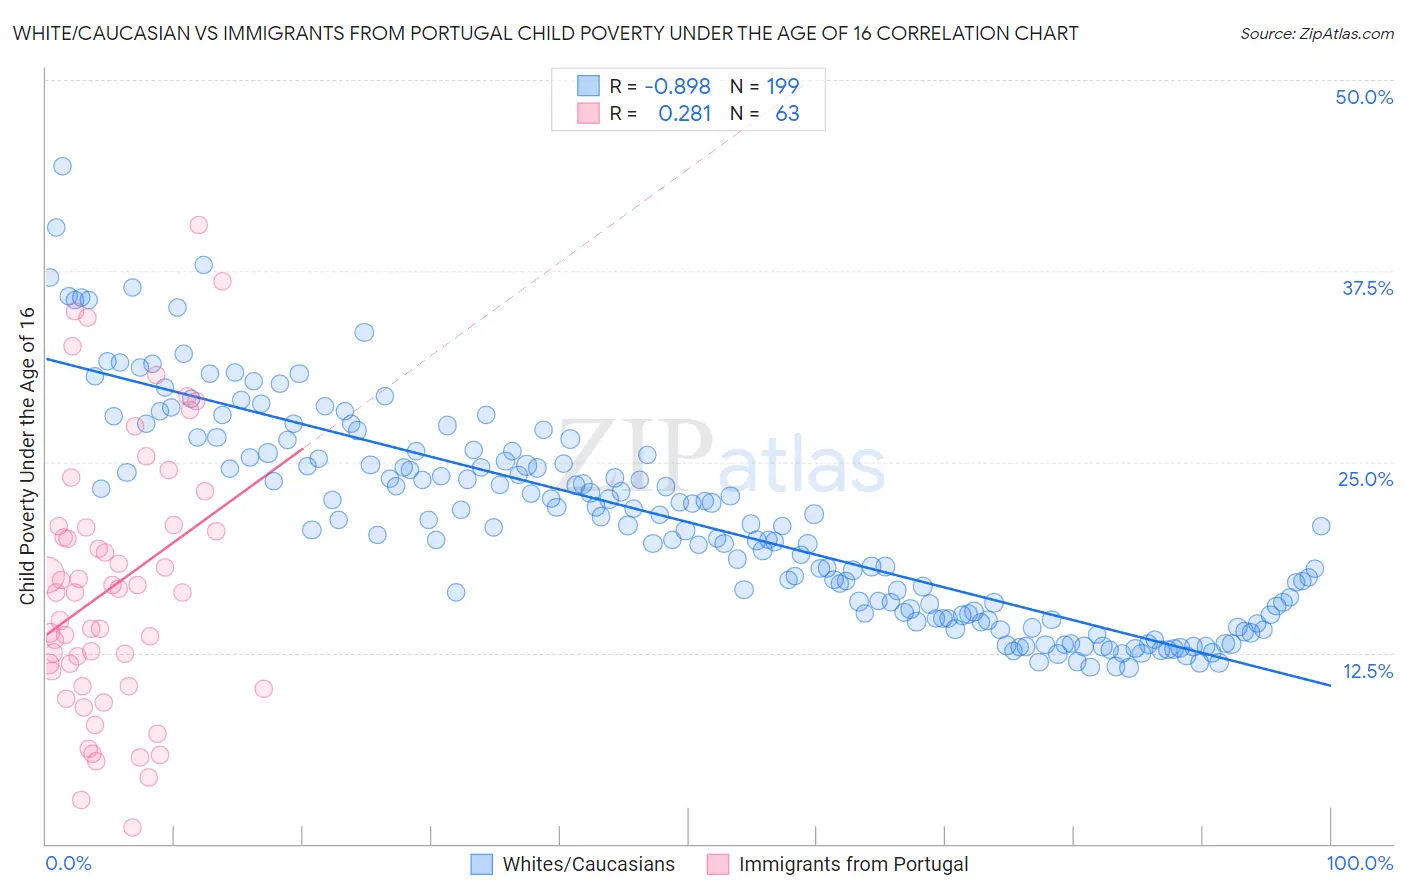
White/Caucasian vs Immigrants from Portugal Child Poverty Under the Age of 16 Correlation Chart
The statistical analysis conducted on geographies consisting of 568,969,283 people shows a very strong negative correlation between the proportion of Whites/Caucasians and poverty level among children under the age of 16 in the United States with a correlation coefficient (R) of -0.898 and weighted average of 16.2%. Similarly, the statistical analysis conducted on geographies consisting of 173,575,253 people shows a weak positive correlation between the proportion of Immigrants from Portugal and poverty level among children under the age of 16 in the United States with a correlation coefficient (R) of 0.281 and weighted average of 16.6%, a difference of 2.5%.
Child Poverty Under the Age of 16 Correlation Summary
| Measurement | White/Caucasian | Immigrants from Portugal |
| Minimum | 11.5% | 1.1% |
| Maximum | 44.4% | 40.5% |
| Range | 32.8% | 39.4% |
| Mean | 21.1% | 16.9% |
| Median | 20.8% | 16.4% |
| Interquartile 25% (IQ1) | 15.0% | 10.3% |
| Interquartile 75% (IQ3) | 25.3% | 20.8% |
| Interquartile Range (IQR) | 10.4% | 10.5% |
| Standard Deviation (Sample) | 6.9% | 8.8% |
| Standard Deviation (Population) | 6.8% | 8.7% |
Demographics Similar to Whites/Caucasians and Immigrants from Portugal by Child Poverty Under the Age of 16
In terms of child poverty under the age of 16, the demographic groups most similar to Whites/Caucasians are Immigrants from Saudi Arabia (16.2%, a difference of 0.25%), Afghan (16.2%, a difference of 0.27%), Hungarian (16.2%, a difference of 0.30%), Scotch-Irish (16.3%, a difference of 0.34%), and Lebanese (16.3%, a difference of 0.50%). Similarly, the demographic groups most similar to Immigrants from Portugal are Immigrants from Costa Rica (16.6%, a difference of 0.060%), Immigrants from Morocco (16.6%, a difference of 0.17%), Arab (16.6%, a difference of 0.19%), Immigrants from Iraq (16.7%, a difference of 0.25%), and Kenyan (16.5%, a difference of 0.55%).
| Demographics | Rating | Rank | Child Poverty Under the Age of 16 |
| Hungarians | 52.5 /100 | #171 | Average 16.2% |
| Afghans | 52.3 /100 | #172 | Average 16.2% |
| Immigrants | Saudi Arabia | 52.1 /100 | #173 | Average 16.2% |
| Whites/Caucasians | 50.0 /100 | #174 | Average 16.2% |
| Scotch-Irish | 47.1 /100 | #175 | Average 16.3% |
| Lebanese | 45.9 /100 | #176 | Average 16.3% |
| Ethiopians | 43.4 /100 | #177 | Average 16.3% |
| Immigrants | Ethiopia | 42.3 /100 | #178 | Average 16.4% |
| Immigrants | Syria | 42.3 /100 | #179 | Average 16.4% |
| South American Indians | 41.8 /100 | #180 | Average 16.4% |
| Immigrants | South America | 40.8 /100 | #181 | Average 16.4% |
| Hawaiians | 38.2 /100 | #182 | Fair 16.4% |
| Celtics | 38.2 /100 | #183 | Fair 16.4% |
| Immigrants | Western Asia | 38.0 /100 | #184 | Fair 16.4% |
| Immigrants | Bosnia and Herzegovina | 37.4 /100 | #185 | Fair 16.5% |
| Kenyans | 34.1 /100 | #186 | Fair 16.5% |
| Arabs | 31.4 /100 | #187 | Fair 16.6% |
| Immigrants | Morocco | 31.2 /100 | #188 | Fair 16.6% |
| Immigrants | Portugal | 30.0 /100 | #189 | Fair 16.6% |
| Immigrants | Costa Rica | 29.6 /100 | #190 | Fair 16.6% |
| Immigrants | Iraq | 28.3 /100 | #191 | Fair 16.7% |