Ghanaian vs Immigrants from Portugal Disability Age Over 75
COMPARE
Ghanaian
Immigrants from Portugal
Disability Age Over 75
Disability Age Over 75 Comparison
Ghanaians
Immigrants from Portugal
47.5%
DISABILITY AGE OVER 75
33.0/ 100
METRIC RATING
185th/ 347
METRIC RANK
47.6%
DISABILITY AGE OVER 75
23.8/ 100
METRIC RATING
196th/ 347
METRIC RANK
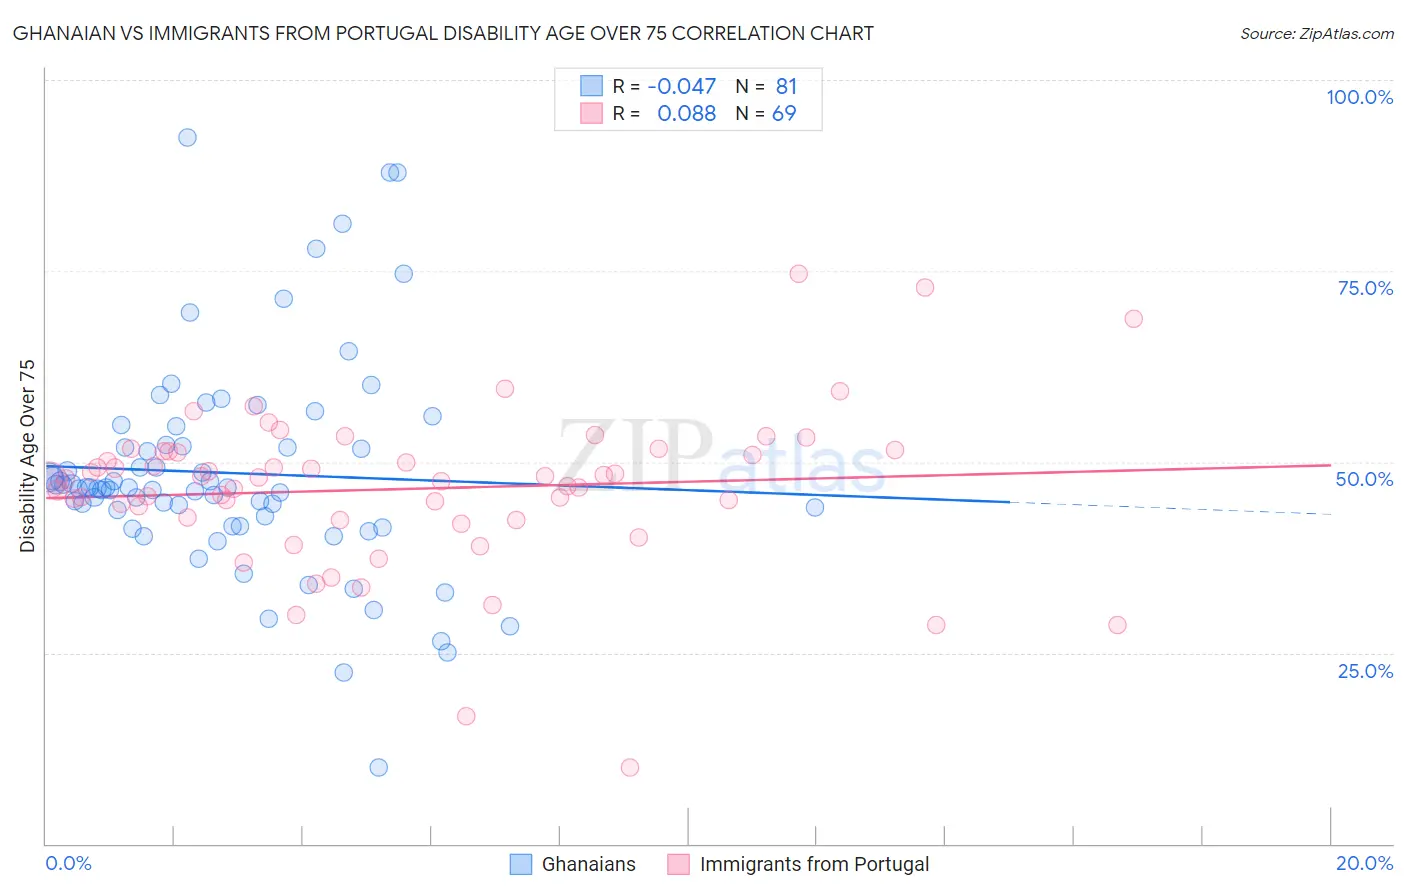
Ghanaian vs Immigrants from Portugal Disability Age Over 75 Correlation Chart
The statistical analysis conducted on geographies consisting of 190,232,806 people shows no correlation between the proportion of Ghanaians and percentage of population with a disability over the age of 75 in the United States with a correlation coefficient (R) of -0.047 and weighted average of 47.5%. Similarly, the statistical analysis conducted on geographies consisting of 174,707,158 people shows a slight positive correlation between the proportion of Immigrants from Portugal and percentage of population with a disability over the age of 75 in the United States with a correlation coefficient (R) of 0.088 and weighted average of 47.6%, a difference of 0.26%.
Disability Age Over 75 Correlation Summary
| Measurement | Ghanaian | Immigrants from Portugal |
| Minimum | 10.0% | 10.0% |
| Maximum | 92.5% | 74.7% |
| Range | 82.5% | 64.7% |
| Mean | 48.6% | 46.5% |
| Median | 46.6% | 47.7% |
| Interquartile 25% (IQ1) | 42.2% | 42.6% |
| Interquartile 75% (IQ3) | 52.1% | 51.4% |
| Interquartile Range (IQR) | 9.9% | 8.8% |
| Standard Deviation (Sample) | 14.0% | 10.4% |
| Standard Deviation (Population) | 14.0% | 10.3% |
Demographics Similar to Ghanaians and Immigrants from Portugal by Disability Age Over 75
In terms of disability age over 75, the demographic groups most similar to Ghanaians are Immigrants from Nigeria (47.5%, a difference of 0.030%), Sudanese (47.5%, a difference of 0.030%), Immigrants from Sudan (47.5%, a difference of 0.030%), Basque (47.6%, a difference of 0.060%), and Immigrants from Kenya (47.6%, a difference of 0.060%). Similarly, the demographic groups most similar to Immigrants from Portugal are Pakistani (47.7%, a difference of 0.010%), Immigrants from Ukraine (47.7%, a difference of 0.020%), Immigrants from Eritrea (47.7%, a difference of 0.040%), Immigrants from Trinidad and Tobago (47.6%, a difference of 0.050%), and Immigrants from Lebanon (47.6%, a difference of 0.080%).
| Demographics | Rating | Rank | Disability Age Over 75 |
| Immigrants | Ecuador | 41.7 /100 | #180 | Average 47.4% |
| Immigrants | Kazakhstan | 40.4 /100 | #181 | Average 47.4% |
| Immigrants | Moldova | 39.9 /100 | #182 | Fair 47.4% |
| Delaware | 39.1 /100 | #183 | Fair 47.5% |
| Immigrants | Nigeria | 34.0 /100 | #184 | Fair 47.5% |
| Ghanaians | 33.0 /100 | #185 | Fair 47.5% |
| Sudanese | 32.0 /100 | #186 | Fair 47.5% |
| Immigrants | Sudan | 31.8 /100 | #187 | Fair 47.5% |
| Basques | 30.9 /100 | #188 | Fair 47.6% |
| Immigrants | Kenya | 30.8 /100 | #189 | Fair 47.6% |
| Somalis | 29.5 /100 | #190 | Fair 47.6% |
| Portuguese | 29.3 /100 | #191 | Fair 47.6% |
| Immigrants | Jamaica | 28.3 /100 | #192 | Fair 47.6% |
| Ottawa | 28.1 /100 | #193 | Fair 47.6% |
| Immigrants | Lebanon | 26.5 /100 | #194 | Fair 47.6% |
| Immigrants | Trinidad and Tobago | 25.3 /100 | #195 | Fair 47.6% |
| Immigrants | Portugal | 23.8 /100 | #196 | Fair 47.6% |
| Pakistanis | 23.4 /100 | #197 | Fair 47.7% |
| Immigrants | Ukraine | 23.2 /100 | #198 | Fair 47.7% |
| Immigrants | Eritrea | 22.4 /100 | #199 | Fair 47.7% |
| Immigrants | Somalia | 21.4 /100 | #200 | Fair 47.7% |