White/Caucasian vs Hispanic or Latino Disability
COMPARE
White/Caucasian
Hispanic or Latino
Disability
Disability Comparison
Whites/Caucasians
Hispanics or Latinos
13.0%
DISABILITY
0.0/ 100
METRIC RATING
288th/ 347
METRIC RANK
12.1%
DISABILITY
3.9/ 100
METRIC RATING
223rd/ 347
METRIC RANK
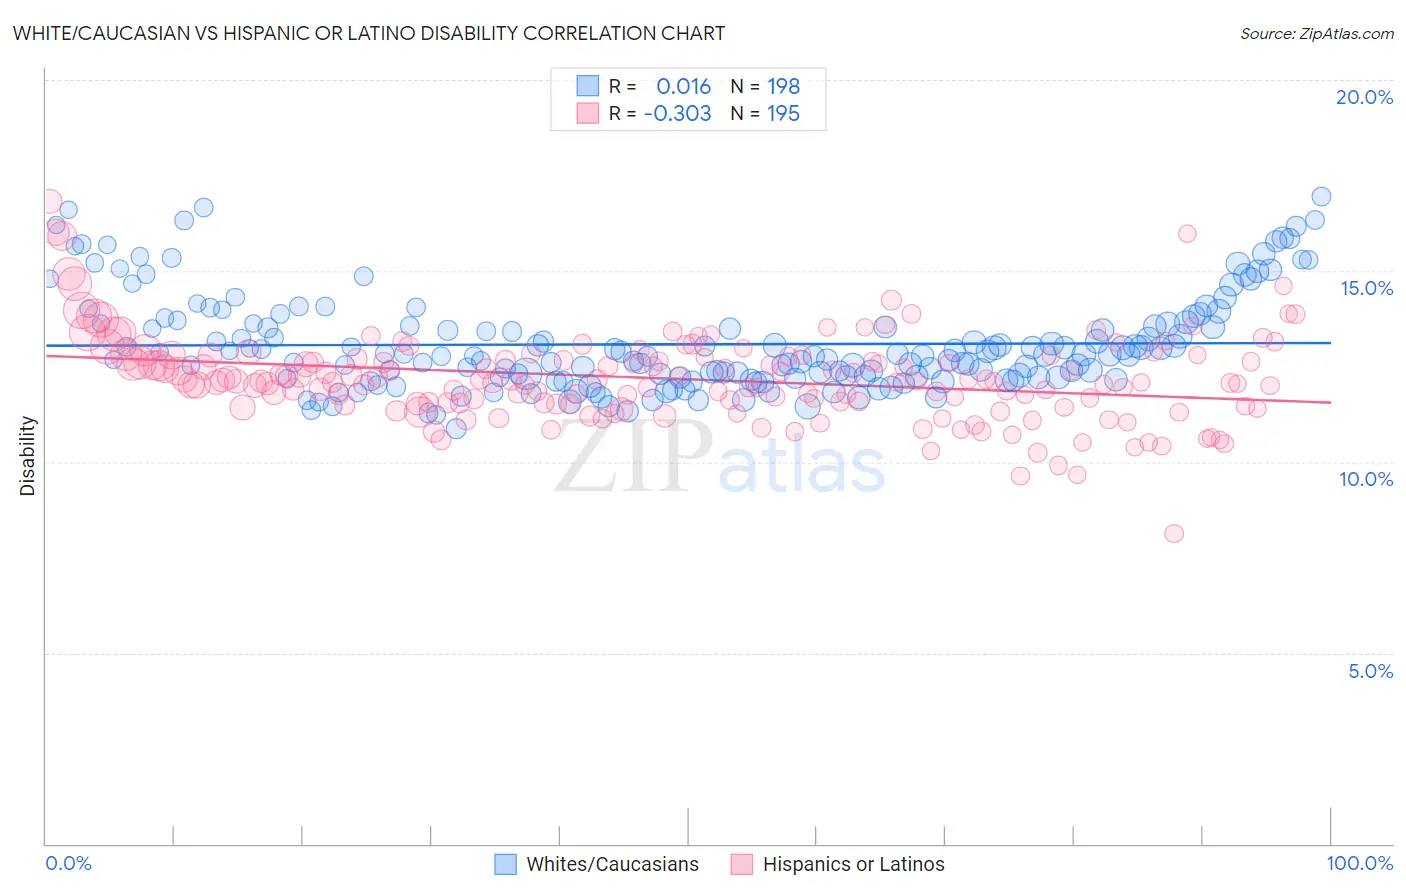
White/Caucasian vs Hispanic or Latino Disability Correlation Chart
The statistical analysis conducted on geographies consisting of 583,070,894 people shows no correlation between the proportion of Whites/Caucasians and percentage of population with a disability in the United States with a correlation coefficient (R) of 0.016 and weighted average of 13.0%. Similarly, the statistical analysis conducted on geographies consisting of 572,941,997 people shows a mild negative correlation between the proportion of Hispanics or Latinos and percentage of population with a disability in the United States with a correlation coefficient (R) of -0.303 and weighted average of 12.1%, a difference of 7.4%.
Disability Correlation Summary
| Measurement | White/Caucasian | Hispanic or Latino |
| Minimum | 10.9% | 8.1% |
| Maximum | 16.9% | 16.8% |
| Range | 6.1% | 8.7% |
| Mean | 13.1% | 12.2% |
| Median | 12.8% | 12.1% |
| Interquartile 25% (IQ1) | 12.2% | 11.5% |
| Interquartile 75% (IQ3) | 13.6% | 12.7% |
| Interquartile Range (IQR) | 1.4% | 1.2% |
| Standard Deviation (Sample) | 1.3% | 1.1% |
| Standard Deviation (Population) | 1.3% | 1.1% |
Similar Demographics by Disability
Demographics Similar to Whites/Caucasians by Disability
In terms of disability, the demographic groups most similar to Whites/Caucasians are Slovak (13.0%, a difference of 0.0%), African (13.0%, a difference of 0.020%), Cheyenne (13.0%, a difference of 0.060%), Yaqui (13.1%, a difference of 0.29%), and English (13.0%, a difference of 0.43%).
| Demographics | Rating | Rank | Disability |
| Immigrants | Portugal | 0.0 /100 | #281 | Tragic 12.9% |
| Scottish | 0.0 /100 | #282 | Tragic 12.9% |
| Irish | 0.0 /100 | #283 | Tragic 12.9% |
| Welsh | 0.0 /100 | #284 | Tragic 12.9% |
| Crow | 0.0 /100 | #285 | Tragic 12.9% |
| English | 0.0 /100 | #286 | Tragic 13.0% |
| Africans | 0.0 /100 | #287 | Tragic 13.0% |
| Whites/Caucasians | 0.0 /100 | #288 | Tragic 13.0% |
| Slovaks | 0.0 /100 | #289 | Tragic 13.0% |
| Cheyenne | 0.0 /100 | #290 | Tragic 13.0% |
| Yaqui | 0.0 /100 | #291 | Tragic 13.1% |
| Aleuts | 0.0 /100 | #292 | Tragic 13.1% |
| Marshallese | 0.0 /100 | #293 | Tragic 13.1% |
| Celtics | 0.0 /100 | #294 | Tragic 13.1% |
| Immigrants | Nonimmigrants | 0.0 /100 | #295 | Tragic 13.2% |
Demographics Similar to Hispanics or Latinos by Disability
In terms of disability, the demographic groups most similar to Hispanics or Latinos are Spanish American Indian (12.1%, a difference of 0.040%), Mexican (12.1%, a difference of 0.060%), Northern European (12.1%, a difference of 0.070%), Senegalese (12.1%, a difference of 0.15%), and Immigrants from Bahamas (12.1%, a difference of 0.19%).
| Demographics | Rating | Rank | Disability |
| Panamanians | 5.4 /100 | #216 | Tragic 12.1% |
| Immigrants | North America | 5.3 /100 | #217 | Tragic 12.1% |
| Immigrants | Jamaica | 5.0 /100 | #218 | Tragic 12.1% |
| Croatians | 4.9 /100 | #219 | Tragic 12.1% |
| Immigrants | Bahamas | 4.7 /100 | #220 | Tragic 12.1% |
| Northern Europeans | 4.2 /100 | #221 | Tragic 12.1% |
| Spanish American Indians | 4.1 /100 | #222 | Tragic 12.1% |
| Hispanics or Latinos | 3.9 /100 | #223 | Tragic 12.1% |
| Mexicans | 3.7 /100 | #224 | Tragic 12.1% |
| Senegalese | 3.5 /100 | #225 | Tragic 12.1% |
| Jamaicans | 3.3 /100 | #226 | Tragic 12.1% |
| Alsatians | 3.3 /100 | #227 | Tragic 12.1% |
| West Indians | 2.9 /100 | #228 | Tragic 12.2% |
| Inupiat | 2.8 /100 | #229 | Tragic 12.2% |
| Samoans | 2.6 /100 | #230 | Tragic 12.2% |