White/Caucasian vs Sioux Disability
COMPARE
White/Caucasian
Sioux
Disability
Disability Comparison
Whites/Caucasians
Sioux
13.0%
DISABILITY
0.0/ 100
METRIC RATING
288th/ 347
METRIC RANK
12.8%
DISABILITY
0.0/ 100
METRIC RATING
275th/ 347
METRIC RANK
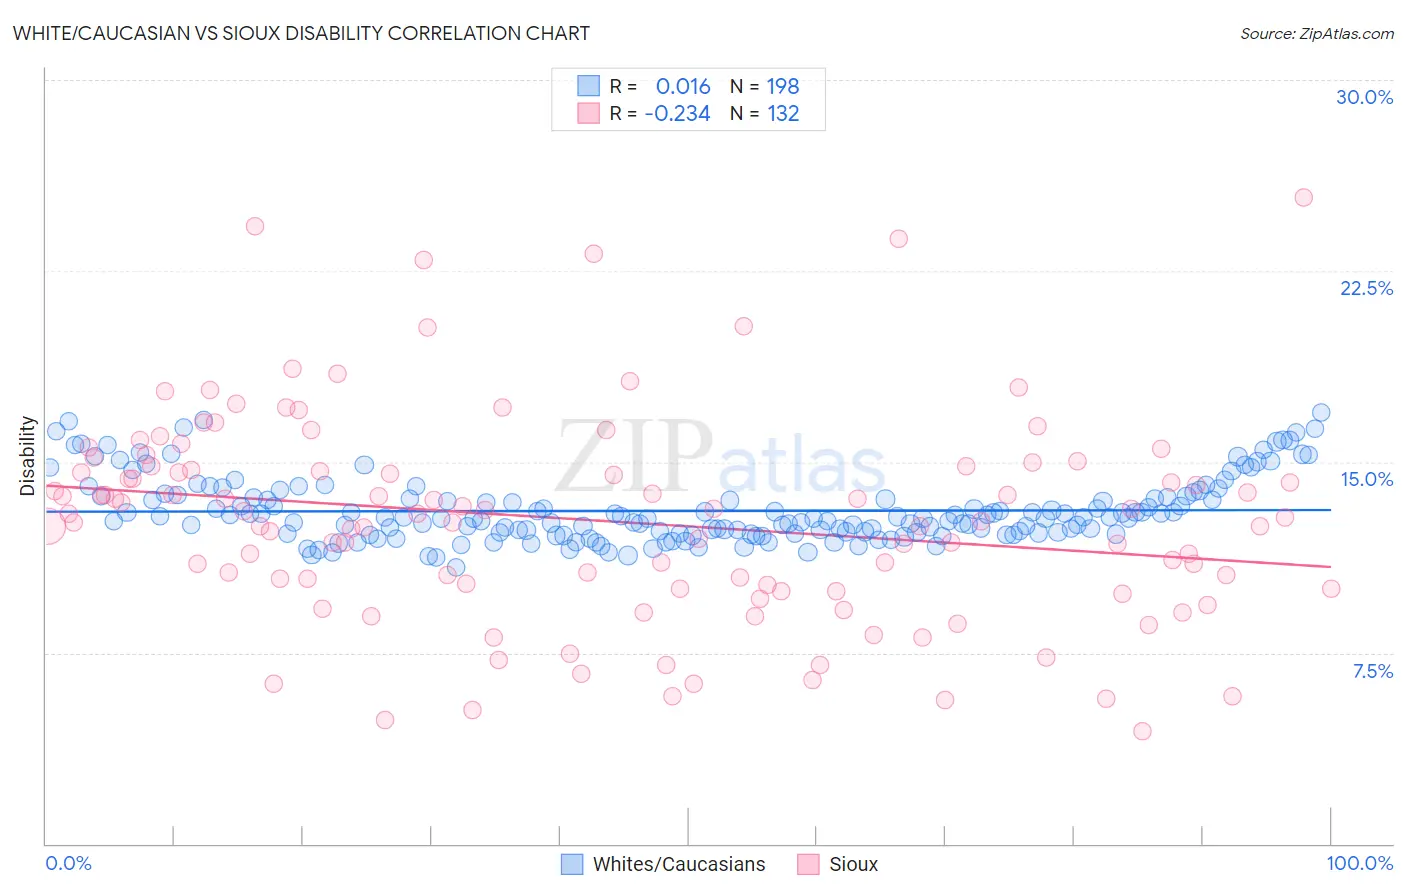
White/Caucasian vs Sioux Disability Correlation Chart
The statistical analysis conducted on geographies consisting of 583,070,894 people shows no correlation between the proportion of Whites/Caucasians and percentage of population with a disability in the United States with a correlation coefficient (R) of 0.016 and weighted average of 13.0%. Similarly, the statistical analysis conducted on geographies consisting of 234,155,753 people shows a weak negative correlation between the proportion of Sioux and percentage of population with a disability in the United States with a correlation coefficient (R) of -0.234 and weighted average of 12.8%, a difference of 1.8%.
Disability Correlation Summary
| Measurement | White/Caucasian | Sioux |
| Minimum | 10.9% | 4.4% |
| Maximum | 16.9% | 25.4% |
| Range | 6.1% | 21.0% |
| Mean | 13.1% | 12.7% |
| Median | 12.8% | 12.7% |
| Interquartile 25% (IQ1) | 12.2% | 10.0% |
| Interquartile 75% (IQ3) | 13.6% | 14.8% |
| Interquartile Range (IQR) | 1.4% | 4.7% |
| Standard Deviation (Sample) | 1.3% | 4.1% |
| Standard Deviation (Population) | 1.3% | 4.1% |
Demographics Similar to Whites/Caucasians and Sioux by Disability
In terms of disability, the demographic groups most similar to Whites/Caucasians are Slovak (13.0%, a difference of 0.0%), African (13.0%, a difference of 0.020%), Cheyenne (13.0%, a difference of 0.060%), Yaqui (13.1%, a difference of 0.29%), and English (13.0%, a difference of 0.43%). Similarly, the demographic groups most similar to Sioux are Nepalese (12.8%, a difference of 0.080%), Hmong (12.8%, a difference of 0.15%), Dutch (12.8%, a difference of 0.20%), German (12.8%, a difference of 0.37%), and Fijian (12.8%, a difference of 0.46%).
| Demographics | Rating | Rank | Disability |
| Immigrants | Yemen | 0.1 /100 | #271 | Tragic 12.6% |
| Dominicans | 0.0 /100 | #272 | Tragic 12.7% |
| Finns | 0.0 /100 | #273 | Tragic 12.7% |
| Nepalese | 0.0 /100 | #274 | Tragic 12.8% |
| Sioux | 0.0 /100 | #275 | Tragic 12.8% |
| Hmong | 0.0 /100 | #276 | Tragic 12.8% |
| Dutch | 0.0 /100 | #277 | Tragic 12.8% |
| Germans | 0.0 /100 | #278 | Tragic 12.8% |
| Fijians | 0.0 /100 | #279 | Tragic 12.8% |
| Spanish | 0.0 /100 | #280 | Tragic 12.8% |
| Immigrants | Portugal | 0.0 /100 | #281 | Tragic 12.9% |
| Scottish | 0.0 /100 | #282 | Tragic 12.9% |
| Irish | 0.0 /100 | #283 | Tragic 12.9% |
| Welsh | 0.0 /100 | #284 | Tragic 12.9% |
| Crow | 0.0 /100 | #285 | Tragic 12.9% |
| English | 0.0 /100 | #286 | Tragic 13.0% |
| Africans | 0.0 /100 | #287 | Tragic 13.0% |
| Whites/Caucasians | 0.0 /100 | #288 | Tragic 13.0% |
| Slovaks | 0.0 /100 | #289 | Tragic 13.0% |
| Cheyenne | 0.0 /100 | #290 | Tragic 13.0% |
| Yaqui | 0.0 /100 | #291 | Tragic 13.1% |