White/Caucasian vs Dutch West Indian 4 or more Vehicles in Household
COMPARE
White/Caucasian
Dutch West Indian
4 or more Vehicles in Household
4 or more Vehicles in Household Comparison
Whites/Caucasians
Dutch West Indians
7.4%
4 OR MORE VEHICLES IN HOUSEHOLD
99.8/ 100
METRIC RATING
78th/ 347
METRIC RANK
7.1%
4 OR MORE VEHICLES IN HOUSEHOLD
99.3/ 100
METRIC RATING
94th/ 347
METRIC RANK
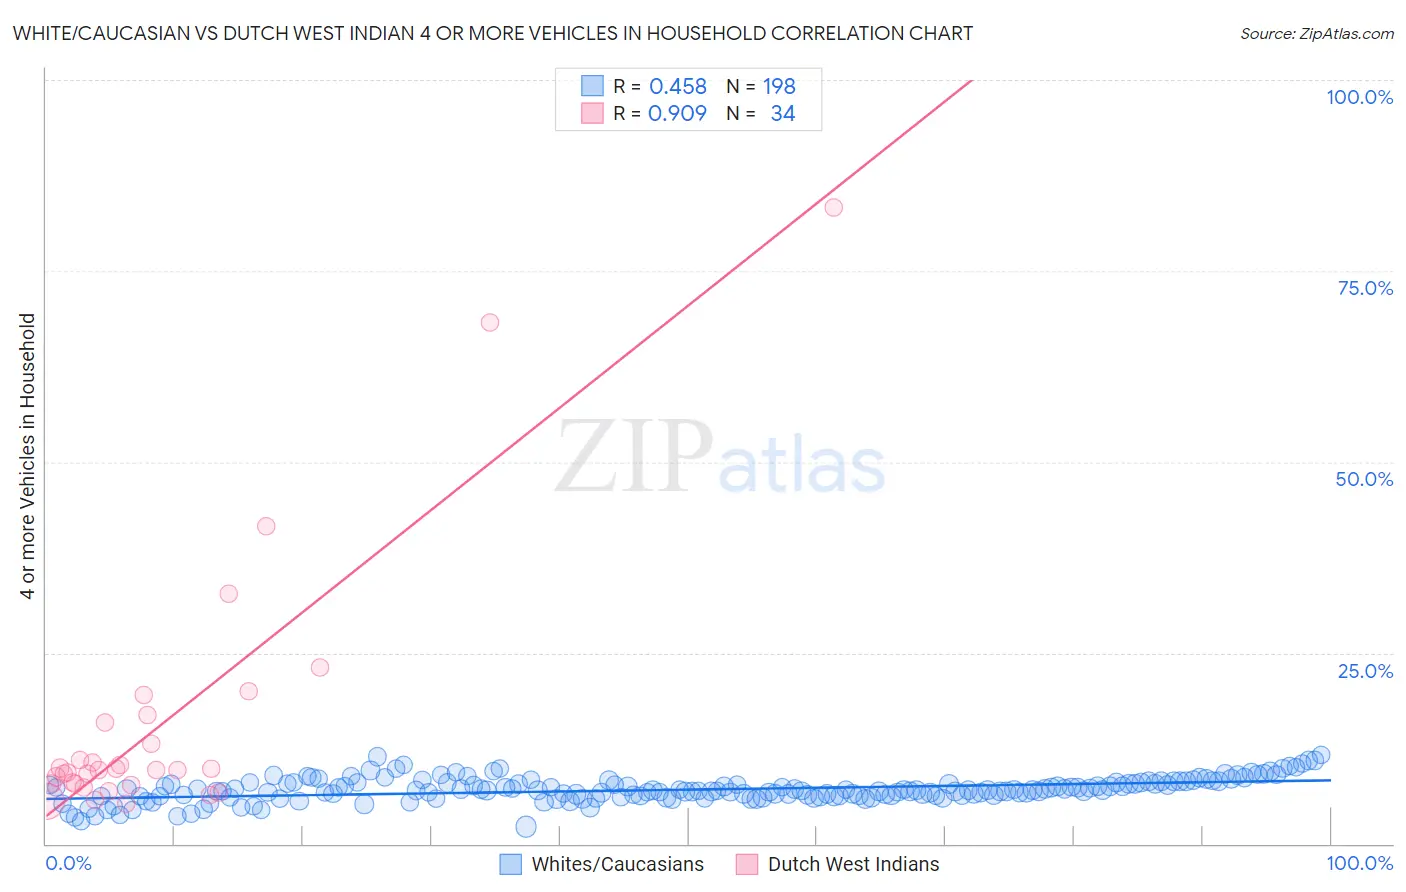
White/Caucasian vs Dutch West Indian 4 or more Vehicles in Household Correlation Chart
The statistical analysis conducted on geographies consisting of 577,913,026 people shows a moderate positive correlation between the proportion of Whites/Caucasians and percentage of households with 4 or more vehicles available in the United States with a correlation coefficient (R) of 0.458 and weighted average of 7.4%. Similarly, the statistical analysis conducted on geographies consisting of 85,699,538 people shows a near-perfect positive correlation between the proportion of Dutch West Indians and percentage of households with 4 or more vehicles available in the United States with a correlation coefficient (R) of 0.909 and weighted average of 7.1%, a difference of 3.3%.
4 or more Vehicles in Household Correlation Summary
| Measurement | White/Caucasian | Dutch West Indian |
| Minimum | 2.2% | 5.3% |
| Maximum | 11.6% | 83.3% |
| Range | 9.4% | 78.0% |
| Mean | 7.1% | 15.8% |
| Median | 7.0% | 9.7% |
| Interquartile 25% (IQ1) | 6.3% | 7.8% |
| Interquartile 75% (IQ3) | 8.0% | 15.8% |
| Interquartile Range (IQR) | 1.7% | 8.0% |
| Standard Deviation (Sample) | 1.5% | 17.2% |
| Standard Deviation (Population) | 1.5% | 16.9% |
Demographics Similar to Whites/Caucasians and Dutch West Indians by 4 or more Vehicles in Household
In terms of 4 or more vehicles in household, the demographic groups most similar to Whites/Caucasians are Apache (7.4%, a difference of 0.060%), Czech (7.4%, a difference of 0.17%), Laotian (7.4%, a difference of 0.23%), Alaska Native (7.3%, a difference of 0.31%), and Finnish (7.3%, a difference of 0.87%). Similarly, the demographic groups most similar to Dutch West Indians are Immigrants from Afghanistan (7.1%, a difference of 0.010%), Immigrants from Latin America (7.1%, a difference of 0.18%), Czechoslovakian (7.1%, a difference of 0.21%), Central American (7.1%, a difference of 0.23%), and Assyrian/Chaldean/Syriac (7.2%, a difference of 0.34%).
| Demographics | Rating | Rank | 4 or more Vehicles in Household |
| Laotians | 99.9 /100 | #76 | Exceptional 7.4% |
| Apache | 99.9 /100 | #77 | Exceptional 7.4% |
| Whites/Caucasians | 99.8 /100 | #78 | Exceptional 7.4% |
| Czechs | 99.8 /100 | #79 | Exceptional 7.4% |
| Alaska Natives | 99.8 /100 | #80 | Exceptional 7.3% |
| Finns | 99.8 /100 | #81 | Exceptional 7.3% |
| Northern Europeans | 99.8 /100 | #82 | Exceptional 7.3% |
| Potawatomi | 99.7 /100 | #83 | Exceptional 7.3% |
| Afghans | 99.7 /100 | #84 | Exceptional 7.3% |
| Cree | 99.7 /100 | #85 | Exceptional 7.2% |
| Immigrants | Indonesia | 99.6 /100 | #86 | Exceptional 7.2% |
| Delaware | 99.6 /100 | #87 | Exceptional 7.2% |
| Immigrants | Nonimmigrants | 99.6 /100 | #88 | Exceptional 7.2% |
| British | 99.6 /100 | #89 | Exceptional 7.2% |
| Creek | 99.6 /100 | #90 | Exceptional 7.2% |
| Assyrians/Chaldeans/Syriacs | 99.4 /100 | #91 | Exceptional 7.2% |
| Immigrants | Latin America | 99.4 /100 | #92 | Exceptional 7.1% |
| Immigrants | Afghanistan | 99.3 /100 | #93 | Exceptional 7.1% |
| Dutch West Indians | 99.3 /100 | #94 | Exceptional 7.1% |
| Czechoslovakians | 99.3 /100 | #95 | Exceptional 7.1% |
| Central Americans | 99.3 /100 | #96 | Exceptional 7.1% |