White/Caucasian vs Immigrants from Kuwait Disability
COMPARE
White/Caucasian
Immigrants from Kuwait
Disability
Disability Comparison
Whites/Caucasians
Immigrants from Kuwait
13.0%
DISABILITY
0.0/ 100
METRIC RATING
288th/ 347
METRIC RANK
10.7%
DISABILITY
100.0/ 100
METRIC RATING
33rd/ 347
METRIC RANK
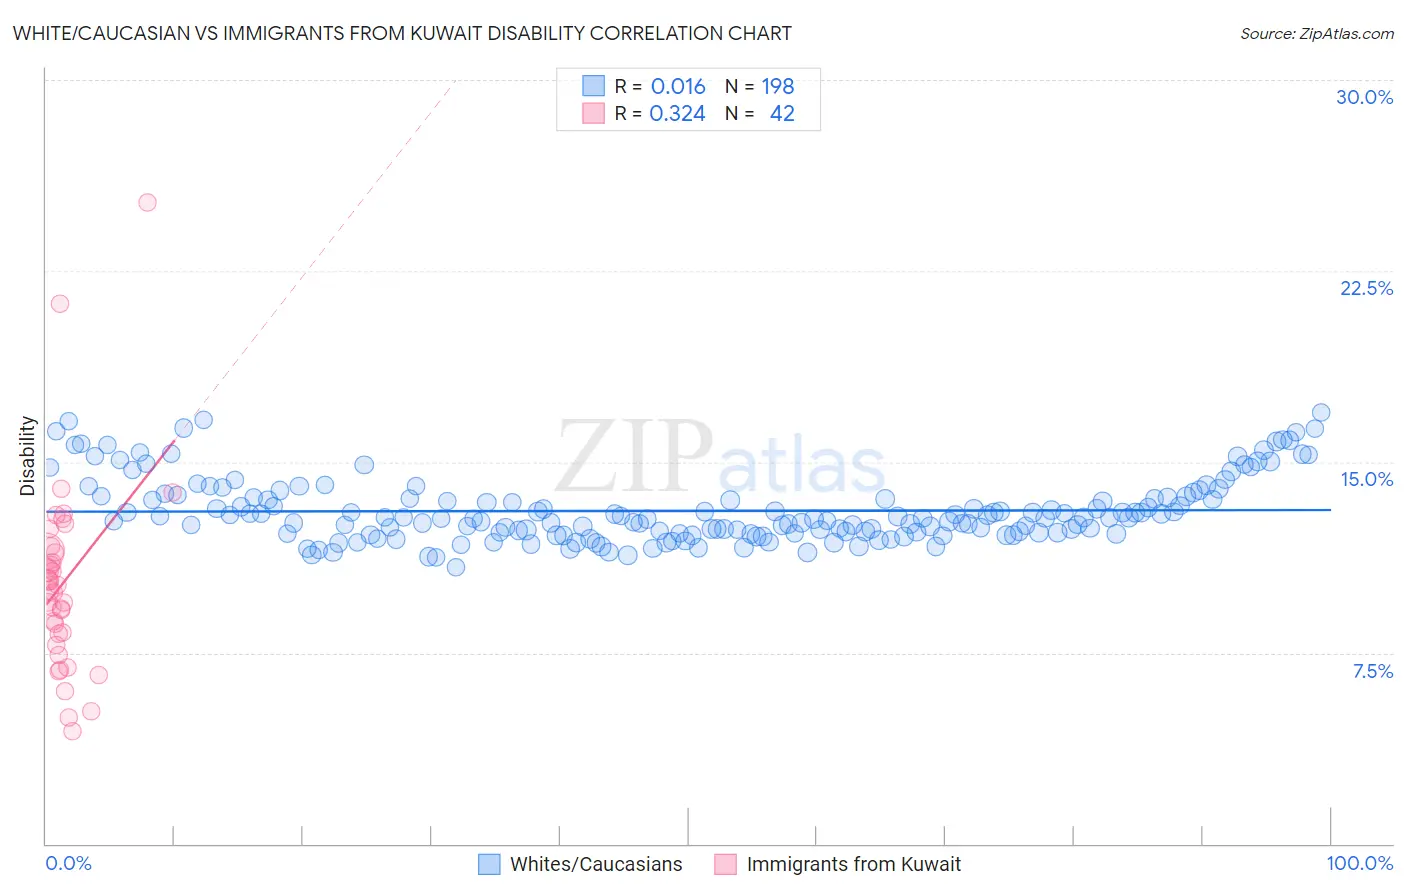
White/Caucasian vs Immigrants from Kuwait Disability Correlation Chart
The statistical analysis conducted on geographies consisting of 583,070,894 people shows no correlation between the proportion of Whites/Caucasians and percentage of population with a disability in the United States with a correlation coefficient (R) of 0.016 and weighted average of 13.0%. Similarly, the statistical analysis conducted on geographies consisting of 136,916,630 people shows a mild positive correlation between the proportion of Immigrants from Kuwait and percentage of population with a disability in the United States with a correlation coefficient (R) of 0.324 and weighted average of 10.7%, a difference of 21.9%.
Disability Correlation Summary
| Measurement | White/Caucasian | Immigrants from Kuwait |
| Minimum | 10.9% | 4.4% |
| Maximum | 16.9% | 25.2% |
| Range | 6.1% | 20.8% |
| Mean | 13.1% | 10.3% |
| Median | 12.8% | 10.0% |
| Interquartile 25% (IQ1) | 12.2% | 8.3% |
| Interquartile 75% (IQ3) | 13.6% | 11.5% |
| Interquartile Range (IQR) | 1.4% | 3.2% |
| Standard Deviation (Sample) | 1.3% | 3.8% |
| Standard Deviation (Population) | 1.3% | 3.8% |
Similar Demographics by Disability
Demographics Similar to Whites/Caucasians by Disability
In terms of disability, the demographic groups most similar to Whites/Caucasians are Slovak (13.0%, a difference of 0.0%), African (13.0%, a difference of 0.020%), Cheyenne (13.0%, a difference of 0.060%), Yaqui (13.1%, a difference of 0.29%), and English (13.0%, a difference of 0.43%).
| Demographics | Rating | Rank | Disability |
| Immigrants | Portugal | 0.0 /100 | #281 | Tragic 12.9% |
| Scottish | 0.0 /100 | #282 | Tragic 12.9% |
| Irish | 0.0 /100 | #283 | Tragic 12.9% |
| Welsh | 0.0 /100 | #284 | Tragic 12.9% |
| Crow | 0.0 /100 | #285 | Tragic 12.9% |
| English | 0.0 /100 | #286 | Tragic 13.0% |
| Africans | 0.0 /100 | #287 | Tragic 13.0% |
| Whites/Caucasians | 0.0 /100 | #288 | Tragic 13.0% |
| Slovaks | 0.0 /100 | #289 | Tragic 13.0% |
| Cheyenne | 0.0 /100 | #290 | Tragic 13.0% |
| Yaqui | 0.0 /100 | #291 | Tragic 13.1% |
| Aleuts | 0.0 /100 | #292 | Tragic 13.1% |
| Marshallese | 0.0 /100 | #293 | Tragic 13.1% |
| Celtics | 0.0 /100 | #294 | Tragic 13.1% |
| Immigrants | Nonimmigrants | 0.0 /100 | #295 | Tragic 13.2% |
Demographics Similar to Immigrants from Kuwait by Disability
In terms of disability, the demographic groups most similar to Immigrants from Kuwait are Immigrants from Ethiopia (10.7%, a difference of 0.22%), Immigrants from Indonesia (10.7%, a difference of 0.23%), Paraguayan (10.6%, a difference of 0.25%), Ethiopian (10.7%, a difference of 0.29%), and Turkish (10.7%, a difference of 0.30%).
| Demographics | Rating | Rank | Disability |
| Argentineans | 100.0 /100 | #26 | Exceptional 10.6% |
| Cypriots | 100.0 /100 | #27 | Exceptional 10.6% |
| Egyptians | 100.0 /100 | #28 | Exceptional 10.6% |
| Immigrants | Argentina | 100.0 /100 | #29 | Exceptional 10.6% |
| Immigrants | Turkey | 100.0 /100 | #30 | Exceptional 10.6% |
| Immigrants | Egypt | 100.0 /100 | #31 | Exceptional 10.6% |
| Paraguayans | 100.0 /100 | #32 | Exceptional 10.6% |
| Immigrants | Kuwait | 100.0 /100 | #33 | Exceptional 10.7% |
| Immigrants | Ethiopia | 100.0 /100 | #34 | Exceptional 10.7% |
| Immigrants | Indonesia | 100.0 /100 | #35 | Exceptional 10.7% |
| Ethiopians | 100.0 /100 | #36 | Exceptional 10.7% |
| Turks | 100.0 /100 | #37 | Exceptional 10.7% |
| Afghans | 99.9 /100 | #38 | Exceptional 10.8% |
| Cambodians | 99.9 /100 | #39 | Exceptional 10.8% |
| Mongolians | 99.9 /100 | #40 | Exceptional 10.8% |