Bulgarian vs Apache Disability Age Over 75
COMPARE
Bulgarian
Apache
Disability Age Over 75
Disability Age Over 75 Comparison
Bulgarians
Apache
45.1%
DISABILITY AGE OVER 75
100.0/ 100
METRIC RATING
10th/ 347
METRIC RANK
53.6%
DISABILITY AGE OVER 75
0.0/ 100
METRIC RATING
333rd/ 347
METRIC RANK
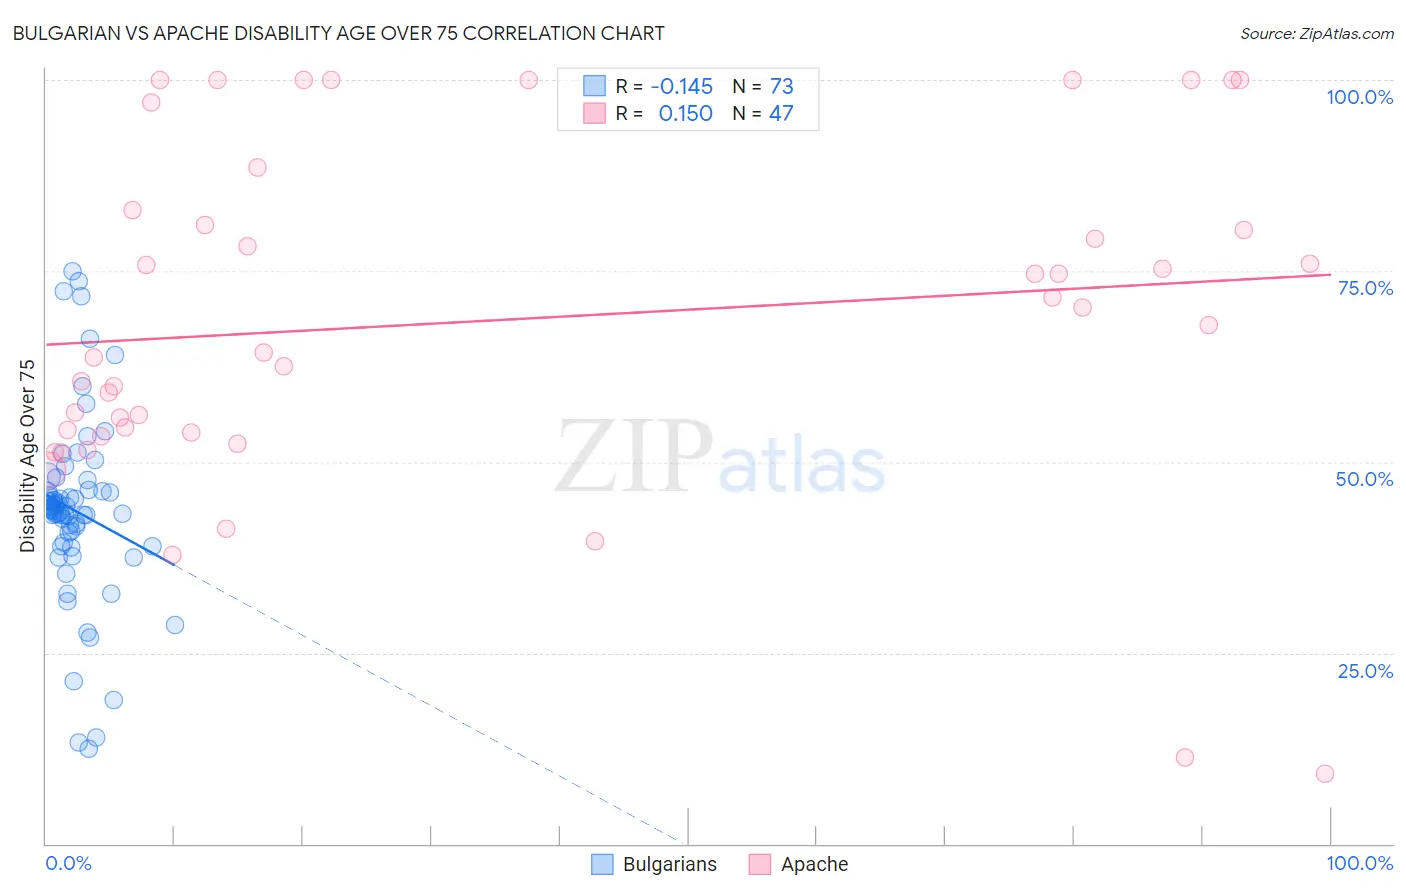
Bulgarian vs Apache Disability Age Over 75 Correlation Chart
The statistical analysis conducted on geographies consisting of 205,489,445 people shows a poor negative correlation between the proportion of Bulgarians and percentage of population with a disability over the age of 75 in the United States with a correlation coefficient (R) of -0.145 and weighted average of 45.1%. Similarly, the statistical analysis conducted on geographies consisting of 230,788,811 people shows a poor positive correlation between the proportion of Apache and percentage of population with a disability over the age of 75 in the United States with a correlation coefficient (R) of 0.150 and weighted average of 53.6%, a difference of 19.0%.
Disability Age Over 75 Correlation Summary
| Measurement | Bulgarian | Apache |
| Minimum | 12.4% | 9.1% |
| Maximum | 75.0% | 100.0% |
| Range | 62.6% | 90.9% |
| Mean | 43.6% | 68.6% |
| Median | 43.7% | 68.0% |
| Interquartile 25% (IQ1) | 39.2% | 53.8% |
| Interquartile 75% (IQ3) | 46.3% | 83.0% |
| Interquartile Range (IQR) | 7.1% | 29.2% |
| Standard Deviation (Sample) | 12.2% | 22.6% |
| Standard Deviation (Population) | 12.1% | 22.4% |
Similar Demographics by Disability Age Over 75
Demographics Similar to Bulgarians by Disability Age Over 75
In terms of disability age over 75, the demographic groups most similar to Bulgarians are Lithuanian (45.1%, a difference of 0.050%), Immigrants from Czechoslovakia (45.1%, a difference of 0.14%), Latvian (45.1%, a difference of 0.15%), Paraguayan (45.0%, a difference of 0.16%), and Immigrants from Scotland (45.1%, a difference of 0.16%).
| Demographics | Rating | Rank | Disability Age Over 75 |
| Eastern Europeans | 100.0 /100 | #3 | Exceptional 44.8% |
| Carpatho Rusyns | 100.0 /100 | #4 | Exceptional 44.8% |
| Luxembourgers | 100.0 /100 | #5 | Exceptional 44.8% |
| Immigrants | Lithuania | 100.0 /100 | #6 | Exceptional 44.9% |
| Okinawans | 100.0 /100 | #7 | Exceptional 44.9% |
| Immigrants | Austria | 100.0 /100 | #8 | Exceptional 44.9% |
| Paraguayans | 100.0 /100 | #9 | Exceptional 45.0% |
| Bulgarians | 100.0 /100 | #10 | Exceptional 45.1% |
| Lithuanians | 100.0 /100 | #11 | Exceptional 45.1% |
| Immigrants | Czechoslovakia | 100.0 /100 | #12 | Exceptional 45.1% |
| Latvians | 100.0 /100 | #13 | Exceptional 45.1% |
| Immigrants | Scotland | 100.0 /100 | #14 | Exceptional 45.1% |
| Immigrants | Sweden | 100.0 /100 | #15 | Exceptional 45.1% |
| Immigrants | Northern Europe | 100.0 /100 | #16 | Exceptional 45.2% |
| Immigrants | India | 100.0 /100 | #17 | Exceptional 45.2% |
Demographics Similar to Apache by Disability Age Over 75
In terms of disability age over 75, the demographic groups most similar to Apache are Alaskan Athabascan (54.0%, a difference of 0.67%), Native/Alaskan (53.1%, a difference of 1.0%), Kiowa (54.2%, a difference of 1.2%), Hopi (52.9%, a difference of 1.3%), and Puerto Rican (52.9%, a difference of 1.3%).
| Demographics | Rating | Rank | Disability Age Over 75 |
| Ute | 0.0 /100 | #326 | Tragic 52.6% |
| Nepalese | 0.0 /100 | #327 | Tragic 52.6% |
| Choctaw | 0.0 /100 | #328 | Tragic 52.7% |
| Alaska Natives | 0.0 /100 | #329 | Tragic 52.8% |
| Puerto Ricans | 0.0 /100 | #330 | Tragic 52.9% |
| Hopi | 0.0 /100 | #331 | Tragic 52.9% |
| Natives/Alaskans | 0.0 /100 | #332 | Tragic 53.1% |
| Apache | 0.0 /100 | #333 | Tragic 53.6% |
| Alaskan Athabascans | 0.0 /100 | #334 | Tragic 54.0% |
| Kiowa | 0.0 /100 | #335 | Tragic 54.2% |
| Immigrants | Armenia | 0.0 /100 | #336 | Tragic 54.3% |
| Yuman | 0.0 /100 | #337 | Tragic 54.4% |
| Colville | 0.0 /100 | #338 | Tragic 55.4% |
| Pima | 0.0 /100 | #339 | Tragic 55.8% |
| Pueblo | 0.0 /100 | #340 | Tragic 55.9% |