Immigrants from Eastern Asia vs Apache Disability Age Over 75
COMPARE
Immigrants from Eastern Asia
Apache
Disability Age Over 75
Disability Age Over 75 Comparison
Immigrants from Eastern Asia
Apache
46.2%
DISABILITY AGE OVER 75
98.9/ 100
METRIC RATING
77th/ 347
METRIC RANK
53.6%
DISABILITY AGE OVER 75
0.0/ 100
METRIC RATING
333rd/ 347
METRIC RANK
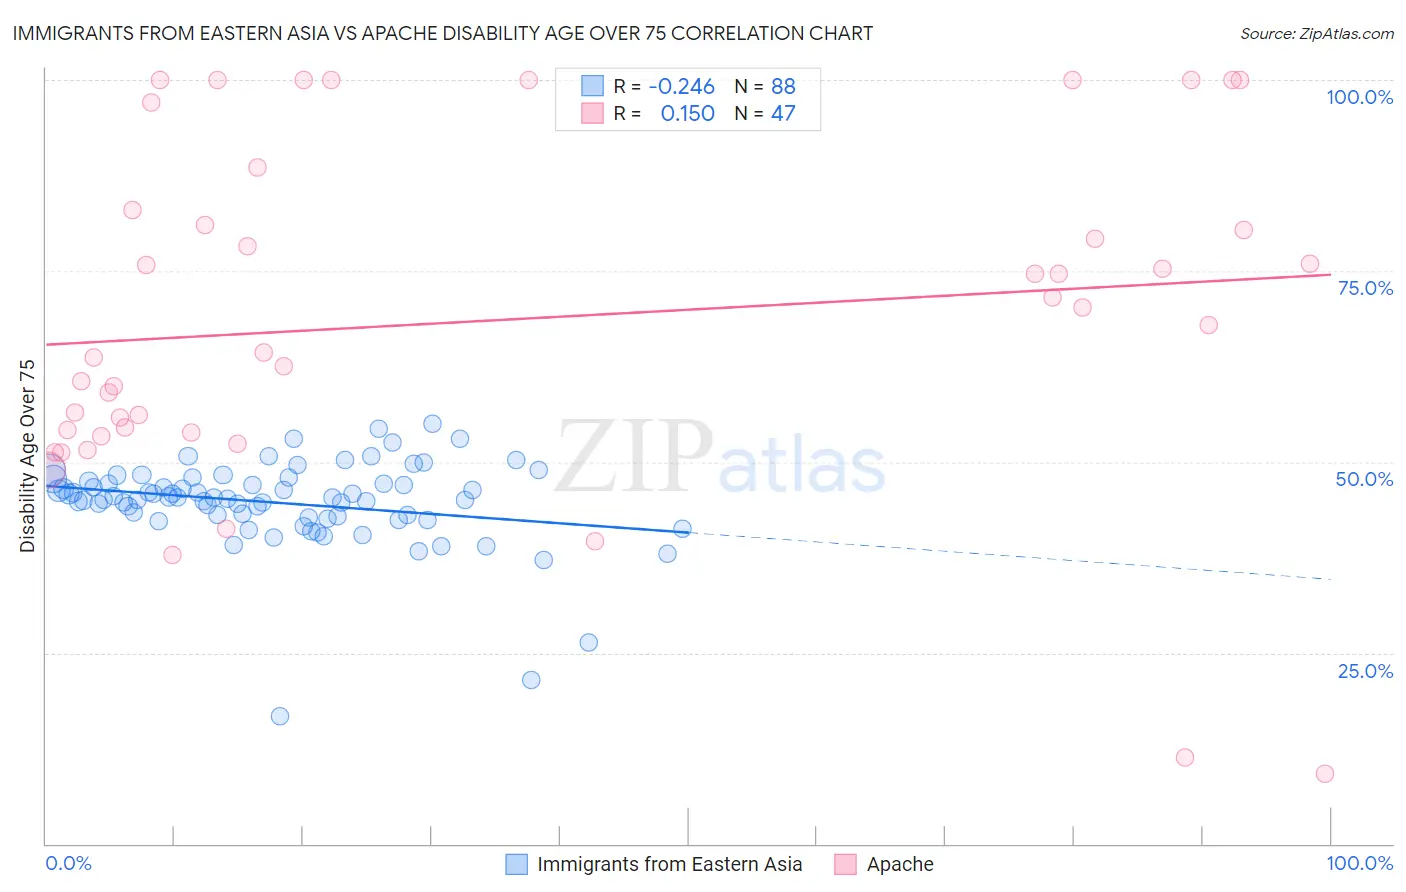
Immigrants from Eastern Asia vs Apache Disability Age Over 75 Correlation Chart
The statistical analysis conducted on geographies consisting of 498,430,406 people shows a weak negative correlation between the proportion of Immigrants from Eastern Asia and percentage of population with a disability over the age of 75 in the United States with a correlation coefficient (R) of -0.246 and weighted average of 46.2%. Similarly, the statistical analysis conducted on geographies consisting of 230,788,811 people shows a poor positive correlation between the proportion of Apache and percentage of population with a disability over the age of 75 in the United States with a correlation coefficient (R) of 0.150 and weighted average of 53.6%, a difference of 16.1%.
Disability Age Over 75 Correlation Summary
| Measurement | Immigrants from Eastern Asia | Apache |
| Minimum | 16.7% | 9.1% |
| Maximum | 54.9% | 100.0% |
| Range | 38.3% | 90.9% |
| Mean | 44.7% | 68.6% |
| Median | 45.3% | 68.0% |
| Interquartile 25% (IQ1) | 42.8% | 53.8% |
| Interquartile 75% (IQ3) | 47.3% | 83.0% |
| Interquartile Range (IQR) | 4.5% | 29.2% |
| Standard Deviation (Sample) | 5.8% | 22.6% |
| Standard Deviation (Population) | 5.7% | 22.4% |
Similar Demographics by Disability Age Over 75
Demographics Similar to Immigrants from Eastern Asia by Disability Age Over 75
In terms of disability age over 75, the demographic groups most similar to Immigrants from Eastern Asia are Immigrants from Western Europe (46.2%, a difference of 0.010%), Slavic (46.1%, a difference of 0.040%), Serbian (46.1%, a difference of 0.050%), Swiss (46.2%, a difference of 0.050%), and Soviet Union (46.2%, a difference of 0.050%).
| Demographics | Rating | Rank | Disability Age Over 75 |
| Jordanians | 99.2 /100 | #70 | Exceptional 46.1% |
| Immigrants | Sri Lanka | 99.2 /100 | #71 | Exceptional 46.1% |
| Immigrants | Hungary | 99.1 /100 | #72 | Exceptional 46.1% |
| Cambodians | 99.1 /100 | #73 | Exceptional 46.1% |
| Egyptians | 99.0 /100 | #74 | Exceptional 46.1% |
| Serbians | 99.0 /100 | #75 | Exceptional 46.1% |
| Slavs | 98.9 /100 | #76 | Exceptional 46.1% |
| Immigrants | Eastern Asia | 98.9 /100 | #77 | Exceptional 46.2% |
| Immigrants | Western Europe | 98.8 /100 | #78 | Exceptional 46.2% |
| Swiss | 98.8 /100 | #79 | Exceptional 46.2% |
| Soviet Union | 98.8 /100 | #80 | Exceptional 46.2% |
| New Zealanders | 98.8 /100 | #81 | Exceptional 46.2% |
| Immigrants | Latvia | 98.7 /100 | #82 | Exceptional 46.2% |
| Argentineans | 98.7 /100 | #83 | Exceptional 46.2% |
| Immigrants | Jordan | 98.7 /100 | #84 | Exceptional 46.2% |
Demographics Similar to Apache by Disability Age Over 75
In terms of disability age over 75, the demographic groups most similar to Apache are Alaskan Athabascan (54.0%, a difference of 0.67%), Native/Alaskan (53.1%, a difference of 1.0%), Kiowa (54.2%, a difference of 1.2%), Hopi (52.9%, a difference of 1.3%), and Puerto Rican (52.9%, a difference of 1.3%).
| Demographics | Rating | Rank | Disability Age Over 75 |
| Ute | 0.0 /100 | #326 | Tragic 52.6% |
| Nepalese | 0.0 /100 | #327 | Tragic 52.6% |
| Choctaw | 0.0 /100 | #328 | Tragic 52.7% |
| Alaska Natives | 0.0 /100 | #329 | Tragic 52.8% |
| Puerto Ricans | 0.0 /100 | #330 | Tragic 52.9% |
| Hopi | 0.0 /100 | #331 | Tragic 52.9% |
| Natives/Alaskans | 0.0 /100 | #332 | Tragic 53.1% |
| Apache | 0.0 /100 | #333 | Tragic 53.6% |
| Alaskan Athabascans | 0.0 /100 | #334 | Tragic 54.0% |
| Kiowa | 0.0 /100 | #335 | Tragic 54.2% |
| Immigrants | Armenia | 0.0 /100 | #336 | Tragic 54.3% |
| Yuman | 0.0 /100 | #337 | Tragic 54.4% |
| Colville | 0.0 /100 | #338 | Tragic 55.4% |
| Pima | 0.0 /100 | #339 | Tragic 55.8% |
| Pueblo | 0.0 /100 | #340 | Tragic 55.9% |