West Indian vs Hmong Disability Age 5 to 17
COMPARE
West Indian
Hmong
Disability Age 5 to 17
Disability Age 5 to 17 Comparison
West Indians
Hmong
5.9%
DISABILITY AGE 5 TO 17
2.4/ 100
METRIC RATING
240th/ 347
METRIC RANK
6.3%
DISABILITY AGE 5 TO 17
0.0/ 100
METRIC RATING
309th/ 347
METRIC RANK
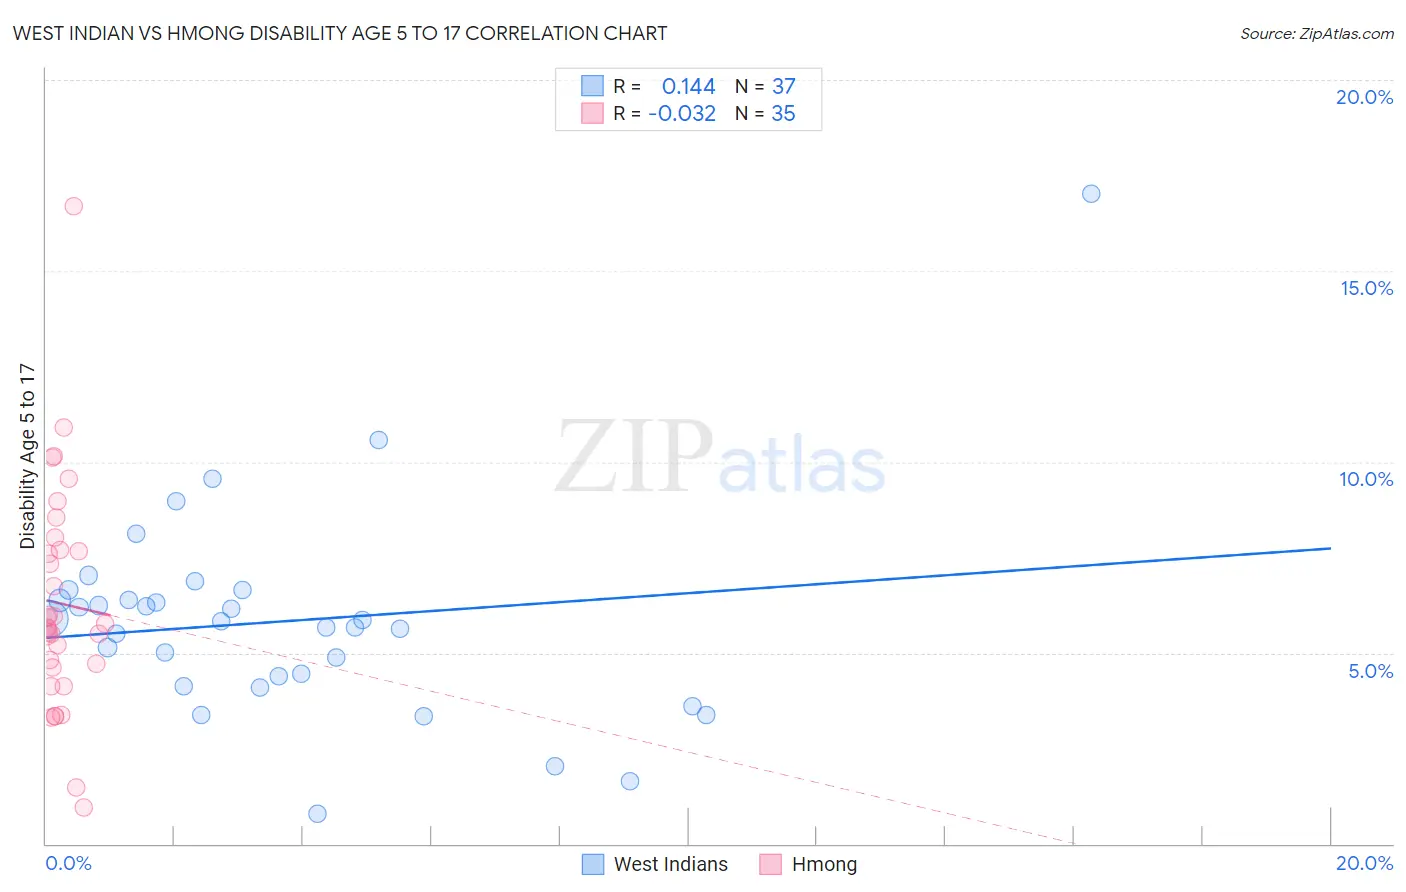
West Indian vs Hmong Disability Age 5 to 17 Correlation Chart
The statistical analysis conducted on geographies consisting of 253,061,388 people shows a poor positive correlation between the proportion of West Indians and percentage of population with a disability between the ages 5 and 17 in the United States with a correlation coefficient (R) of 0.144 and weighted average of 5.9%. Similarly, the statistical analysis conducted on geographies consisting of 24,665,493 people shows no correlation between the proportion of Hmong and percentage of population with a disability between the ages 5 and 17 in the United States with a correlation coefficient (R) of -0.032 and weighted average of 6.3%, a difference of 8.2%.
Disability Age 5 to 17 Correlation Summary
| Measurement | West Indian | Hmong |
| Minimum | 0.79% | 0.96% |
| Maximum | 17.0% | 16.7% |
| Range | 16.2% | 15.7% |
| Mean | 5.8% | 6.3% |
| Median | 5.8% | 5.7% |
| Interquartile 25% (IQ1) | 4.3% | 4.6% |
| Interquartile 75% (IQ3) | 6.5% | 7.7% |
| Interquartile Range (IQR) | 2.3% | 3.1% |
| Standard Deviation (Sample) | 2.8% | 3.0% |
| Standard Deviation (Population) | 2.7% | 2.9% |
Similar Demographics by Disability Age 5 to 17
Demographics Similar to West Indians by Disability Age 5 to 17
In terms of disability age 5 to 17, the demographic groups most similar to West Indians are German Russian (5.9%, a difference of 0.020%), Hungarian (5.8%, a difference of 0.12%), Immigrants from Caribbean (5.9%, a difference of 0.13%), Spaniard (5.9%, a difference of 0.21%), and Sudanese (5.8%, a difference of 0.22%).
| Demographics | Rating | Rank | Disability Age 5 to 17 |
| Immigrants | West Indies | 3.5 /100 | #233 | Tragic 5.8% |
| Immigrants | Kenya | 3.4 /100 | #234 | Tragic 5.8% |
| Malaysians | 3.4 /100 | #235 | Tragic 5.8% |
| Immigrants | Brazil | 3.2 /100 | #236 | Tragic 5.8% |
| Sudanese | 2.9 /100 | #237 | Tragic 5.8% |
| Hungarians | 2.6 /100 | #238 | Tragic 5.8% |
| German Russians | 2.4 /100 | #239 | Tragic 5.9% |
| West Indians | 2.4 /100 | #240 | Tragic 5.9% |
| Immigrants | Caribbean | 2.1 /100 | #241 | Tragic 5.9% |
| Spaniards | 2.0 /100 | #242 | Tragic 5.9% |
| Indonesians | 2.0 /100 | #243 | Tragic 5.9% |
| Immigrants | Germany | 1.9 /100 | #244 | Tragic 5.9% |
| Immigrants | Micronesia | 1.9 /100 | #245 | Tragic 5.9% |
| Tlingit-Haida | 1.9 /100 | #246 | Tragic 5.9% |
| Immigrants | Honduras | 1.8 /100 | #247 | Tragic 5.9% |
Demographics Similar to Hmong by Disability Age 5 to 17
In terms of disability age 5 to 17, the demographic groups most similar to Hmong are Scotch-Irish (6.3%, a difference of 0.020%), Alaskan Athabascan (6.3%, a difference of 0.13%), Immigrants from Dominica (6.3%, a difference of 0.18%), Bahamian (6.3%, a difference of 0.26%), and Bermudan (6.4%, a difference of 0.29%).
| Demographics | Rating | Rank | Disability Age 5 to 17 |
| Celtics | 0.0 /100 | #302 | Tragic 6.3% |
| Yakama | 0.0 /100 | #303 | Tragic 6.3% |
| Senegalese | 0.0 /100 | #304 | Tragic 6.3% |
| Natives/Alaskans | 0.0 /100 | #305 | Tragic 6.3% |
| Immigrants | Nonimmigrants | 0.0 /100 | #306 | Tragic 6.3% |
| Bahamians | 0.0 /100 | #307 | Tragic 6.3% |
| Scotch-Irish | 0.0 /100 | #308 | Tragic 6.3% |
| Hmong | 0.0 /100 | #309 | Tragic 6.3% |
| Alaskan Athabascans | 0.0 /100 | #310 | Tragic 6.3% |
| Immigrants | Dominica | 0.0 /100 | #311 | Tragic 6.3% |
| Bermudans | 0.0 /100 | #312 | Tragic 6.4% |
| Apache | 0.0 /100 | #313 | Tragic 6.4% |
| French | 0.0 /100 | #314 | Tragic 6.4% |
| Immigrants | Portugal | 0.0 /100 | #315 | Tragic 6.4% |
| Immigrants | Dominican Republic | 0.0 /100 | #316 | Tragic 6.4% |