West Indian vs Hmong Median Family Income
COMPARE
West Indian
Hmong
Median Family Income
Median Family Income Comparison
West Indians
Hmong
$92,765
MEDIAN FAMILY INCOME
0.6/ 100
METRIC RATING
250th/ 347
METRIC RANK
$91,296
MEDIAN FAMILY INCOME
0.3/ 100
METRIC RATING
265th/ 347
METRIC RANK
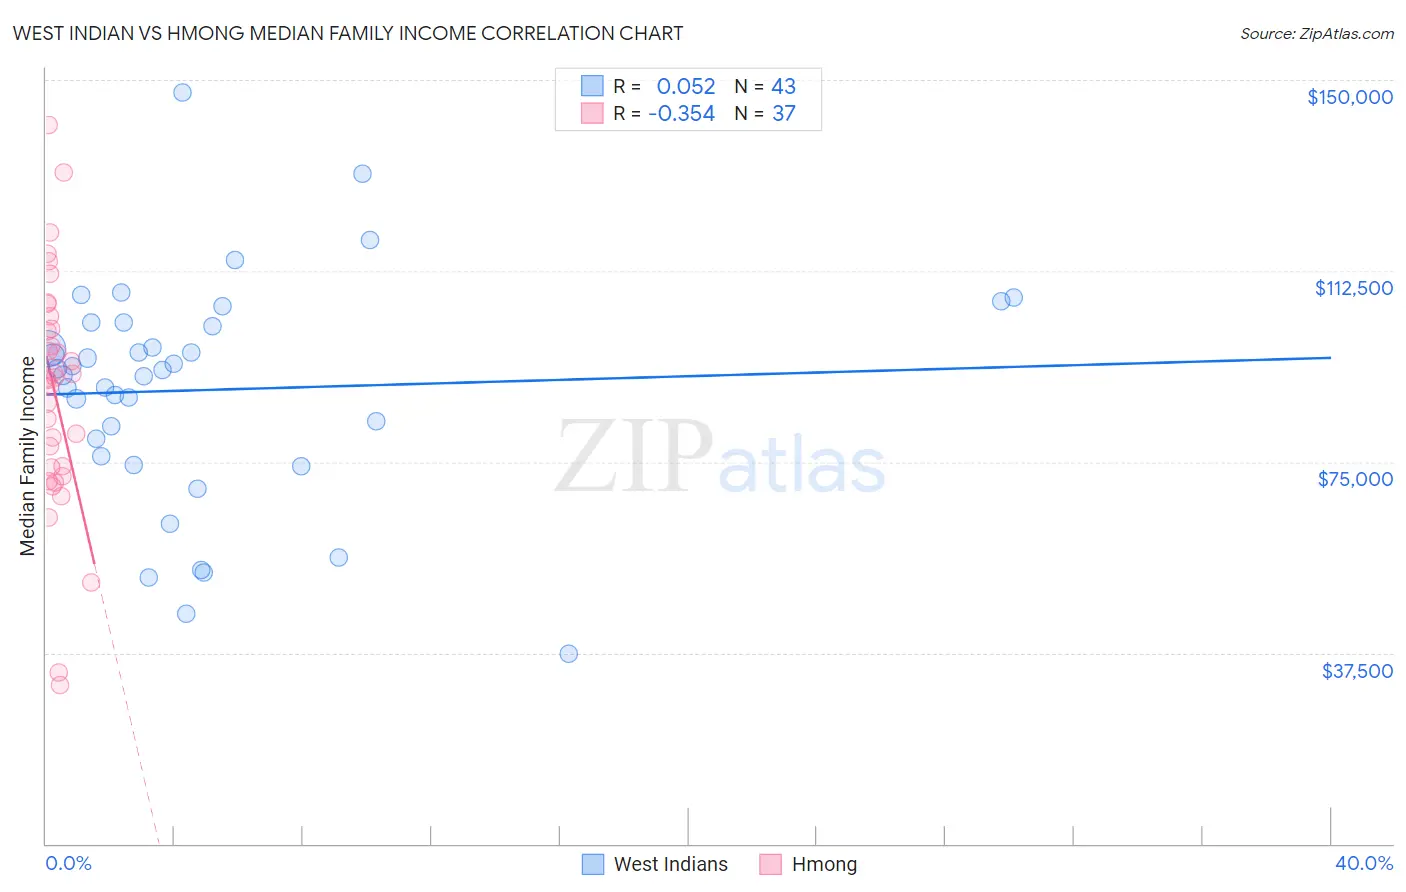
West Indian vs Hmong Median Family Income Correlation Chart
The statistical analysis conducted on geographies consisting of 253,786,025 people shows a slight positive correlation between the proportion of West Indians and median family income in the United States with a correlation coefficient (R) of 0.052 and weighted average of $92,765. Similarly, the statistical analysis conducted on geographies consisting of 24,655,529 people shows a mild negative correlation between the proportion of Hmong and median family income in the United States with a correlation coefficient (R) of -0.354 and weighted average of $91,296, a difference of 1.6%.
Median Family Income Correlation Summary
| Measurement | West Indian | Hmong |
| Minimum | $37,244 | $31,056 |
| Maximum | $147,600 | $141,078 |
| Range | $110,356 | $110,022 |
| Mean | $89,153 | $88,552 |
| Median | $92,948 | $91,363 |
| Interquartile 25% (IQ1) | $76,053 | $73,027 |
| Interquartile 75% (IQ3) | $102,268 | $102,409 |
| Interquartile Range (IQR) | $26,215 | $29,382 |
| Standard Deviation (Sample) | $22,238 | $23,412 |
| Standard Deviation (Population) | $21,978 | $23,093 |
Demographics Similar to West Indians and Hmong by Median Family Income
In terms of median family income, the demographic groups most similar to West Indians are Immigrants from Ecuador ($92,837, a difference of 0.080%), French American Indian ($92,872, a difference of 0.11%), Immigrants from Senegal ($92,912, a difference of 0.16%), Immigrants from Somalia ($92,609, a difference of 0.17%), and Immigrants from El Salvador ($92,545, a difference of 0.24%). Similarly, the demographic groups most similar to Hmong are Senegalese ($91,475, a difference of 0.20%), Central American ($91,087, a difference of 0.23%), Immigrants from West Indies ($91,588, a difference of 0.32%), Mexican American Indian ($90,918, a difference of 0.42%), and Liberian ($91,722, a difference of 0.47%).
| Demographics | Rating | Rank | Median Family Income |
| Immigrants | Senegal | 0.7 /100 | #247 | Tragic $92,912 |
| French American Indians | 0.7 /100 | #248 | Tragic $92,872 |
| Immigrants | Ecuador | 0.7 /100 | #249 | Tragic $92,837 |
| West Indians | 0.6 /100 | #250 | Tragic $92,765 |
| Immigrants | Somalia | 0.6 /100 | #251 | Tragic $92,609 |
| Immigrants | El Salvador | 0.6 /100 | #252 | Tragic $92,545 |
| Immigrants | Guyana | 0.6 /100 | #253 | Tragic $92,513 |
| Immigrants | Barbados | 0.5 /100 | #254 | Tragic $92,419 |
| Immigrants | Laos | 0.5 /100 | #255 | Tragic $92,239 |
| Nicaraguans | 0.5 /100 | #256 | Tragic $92,231 |
| Americans | 0.4 /100 | #257 | Tragic $92,096 |
| Osage | 0.4 /100 | #258 | Tragic $91,926 |
| Cape Verdeans | 0.4 /100 | #259 | Tragic $91,848 |
| Pennsylvania Germans | 0.4 /100 | #260 | Tragic $91,763 |
| Inupiat | 0.4 /100 | #261 | Tragic $91,730 |
| Liberians | 0.4 /100 | #262 | Tragic $91,722 |
| Immigrants | West Indies | 0.3 /100 | #263 | Tragic $91,588 |
| Senegalese | 0.3 /100 | #264 | Tragic $91,475 |
| Hmong | 0.3 /100 | #265 | Tragic $91,296 |
| Central Americans | 0.3 /100 | #266 | Tragic $91,087 |
| Mexican American Indians | 0.2 /100 | #267 | Tragic $90,918 |