West Indian vs Aleut Disability Age 5 to 17
COMPARE
West Indian
Aleut
Disability Age 5 to 17
Disability Age 5 to 17 Comparison
West Indians
Aleuts
5.9%
DISABILITY AGE 5 TO 17
2.4/ 100
METRIC RATING
240th/ 347
METRIC RANK
5.3%
DISABILITY AGE 5 TO 17
97.8/ 100
METRIC RATING
113th/ 347
METRIC RANK
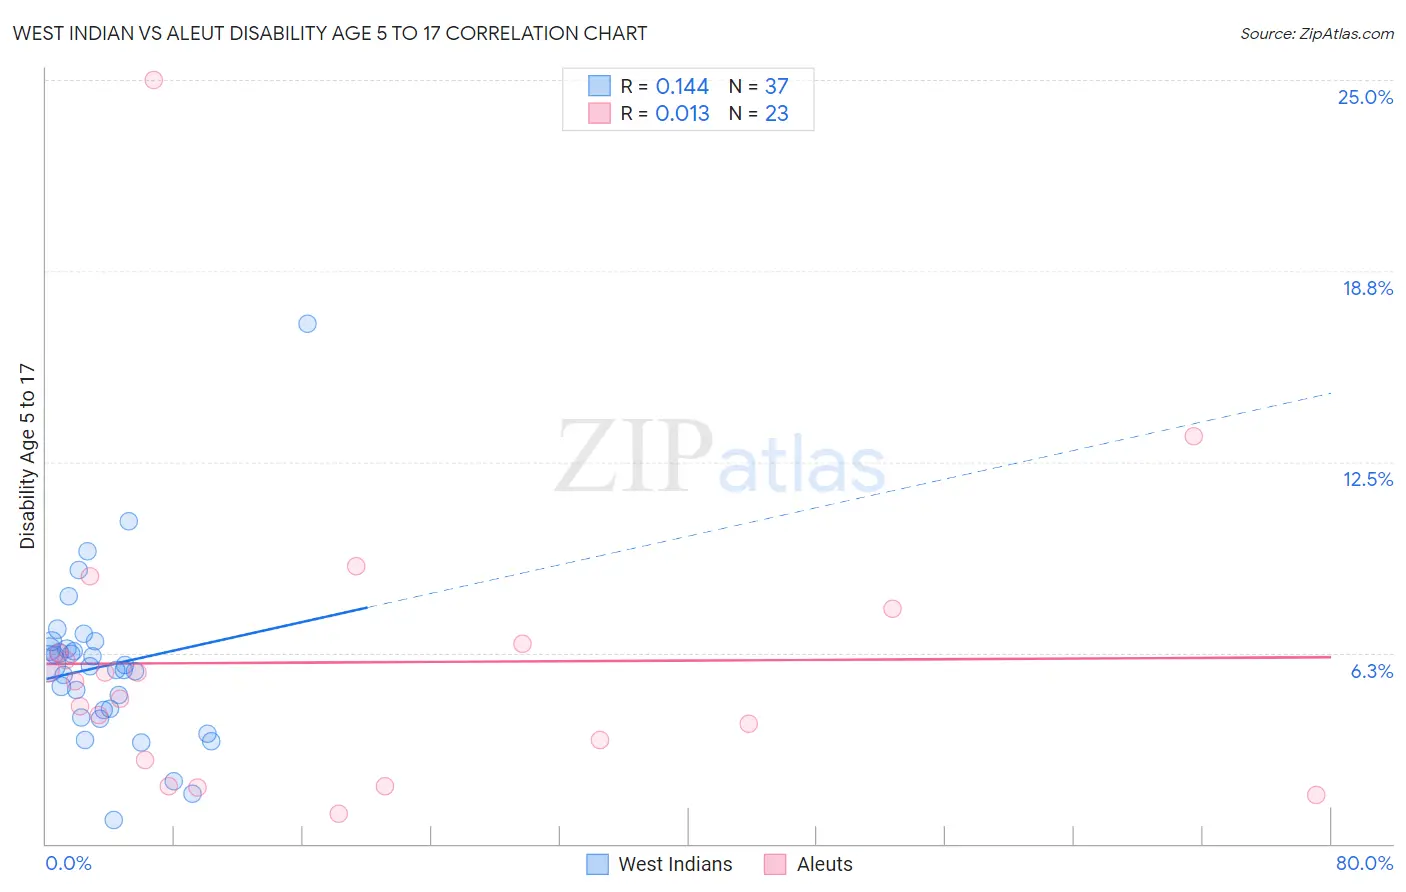
West Indian vs Aleut Disability Age 5 to 17 Correlation Chart
The statistical analysis conducted on geographies consisting of 253,061,388 people shows a poor positive correlation between the proportion of West Indians and percentage of population with a disability between the ages 5 and 17 in the United States with a correlation coefficient (R) of 0.144 and weighted average of 5.9%. Similarly, the statistical analysis conducted on geographies consisting of 61,654,039 people shows no correlation between the proportion of Aleuts and percentage of population with a disability between the ages 5 and 17 in the United States with a correlation coefficient (R) of 0.013 and weighted average of 5.3%, a difference of 9.8%.
Disability Age 5 to 17 Correlation Summary
| Measurement | West Indian | Aleut |
| Minimum | 0.79% | 0.99% |
| Maximum | 17.0% | 25.0% |
| Range | 16.2% | 24.0% |
| Mean | 5.8% | 5.9% |
| Median | 5.8% | 5.3% |
| Interquartile 25% (IQ1) | 4.3% | 2.7% |
| Interquartile 75% (IQ3) | 6.5% | 6.6% |
| Interquartile Range (IQR) | 2.3% | 3.8% |
| Standard Deviation (Sample) | 2.8% | 5.0% |
| Standard Deviation (Population) | 2.7% | 4.9% |
Similar Demographics by Disability Age 5 to 17
Demographics Similar to West Indians by Disability Age 5 to 17
In terms of disability age 5 to 17, the demographic groups most similar to West Indians are German Russian (5.9%, a difference of 0.020%), Hungarian (5.8%, a difference of 0.12%), Immigrants from Caribbean (5.9%, a difference of 0.13%), Spaniard (5.9%, a difference of 0.21%), and Sudanese (5.8%, a difference of 0.22%).
| Demographics | Rating | Rank | Disability Age 5 to 17 |
| Immigrants | West Indies | 3.5 /100 | #233 | Tragic 5.8% |
| Immigrants | Kenya | 3.4 /100 | #234 | Tragic 5.8% |
| Malaysians | 3.4 /100 | #235 | Tragic 5.8% |
| Immigrants | Brazil | 3.2 /100 | #236 | Tragic 5.8% |
| Sudanese | 2.9 /100 | #237 | Tragic 5.8% |
| Hungarians | 2.6 /100 | #238 | Tragic 5.8% |
| German Russians | 2.4 /100 | #239 | Tragic 5.9% |
| West Indians | 2.4 /100 | #240 | Tragic 5.9% |
| Immigrants | Caribbean | 2.1 /100 | #241 | Tragic 5.9% |
| Spaniards | 2.0 /100 | #242 | Tragic 5.9% |
| Indonesians | 2.0 /100 | #243 | Tragic 5.9% |
| Immigrants | Germany | 1.9 /100 | #244 | Tragic 5.9% |
| Immigrants | Micronesia | 1.9 /100 | #245 | Tragic 5.9% |
| Tlingit-Haida | 1.9 /100 | #246 | Tragic 5.9% |
| Immigrants | Honduras | 1.8 /100 | #247 | Tragic 5.9% |
Demographics Similar to Aleuts by Disability Age 5 to 17
In terms of disability age 5 to 17, the demographic groups most similar to Aleuts are Immigrants from Northern Europe (5.3%, a difference of 0.020%), Immigrants from Latvia (5.3%, a difference of 0.040%), Cuban (5.3%, a difference of 0.040%), Ethiopian (5.3%, a difference of 0.060%), and Immigrants from Eritrea (5.3%, a difference of 0.10%).
| Demographics | Rating | Rank | Disability Age 5 to 17 |
| Immigrants | Yemen | 98.2 /100 | #106 | Exceptional 5.3% |
| Russians | 98.2 /100 | #107 | Exceptional 5.3% |
| Immigrants | South Africa | 98.1 /100 | #108 | Exceptional 5.3% |
| Immigrants | Northern Africa | 98.1 /100 | #109 | Exceptional 5.3% |
| Immigrants | Eritrea | 98.0 /100 | #110 | Exceptional 5.3% |
| Ethiopians | 97.9 /100 | #111 | Exceptional 5.3% |
| Immigrants | Latvia | 97.9 /100 | #112 | Exceptional 5.3% |
| Aleuts | 97.8 /100 | #113 | Exceptional 5.3% |
| Immigrants | Northern Europe | 97.8 /100 | #114 | Exceptional 5.3% |
| Cubans | 97.8 /100 | #115 | Exceptional 5.3% |
| Cypriots | 97.7 /100 | #116 | Exceptional 5.3% |
| Immigrants | Afghanistan | 97.4 /100 | #117 | Exceptional 5.3% |
| South Americans | 97.1 /100 | #118 | Exceptional 5.4% |
| Immigrants | South America | 97.1 /100 | #119 | Exceptional 5.4% |
| Immigrants | Immigrants | 97.0 /100 | #120 | Exceptional 5.4% |