Navajo vs Hmong Disability Age 5 to 17
COMPARE
Navajo
Hmong
Disability Age 5 to 17
Disability Age 5 to 17 Comparison
Navajo
Hmong
5.4%
DISABILITY AGE 5 TO 17
90.9/ 100
METRIC RATING
137th/ 347
METRIC RANK
6.3%
DISABILITY AGE 5 TO 17
0.0/ 100
METRIC RATING
309th/ 347
METRIC RANK
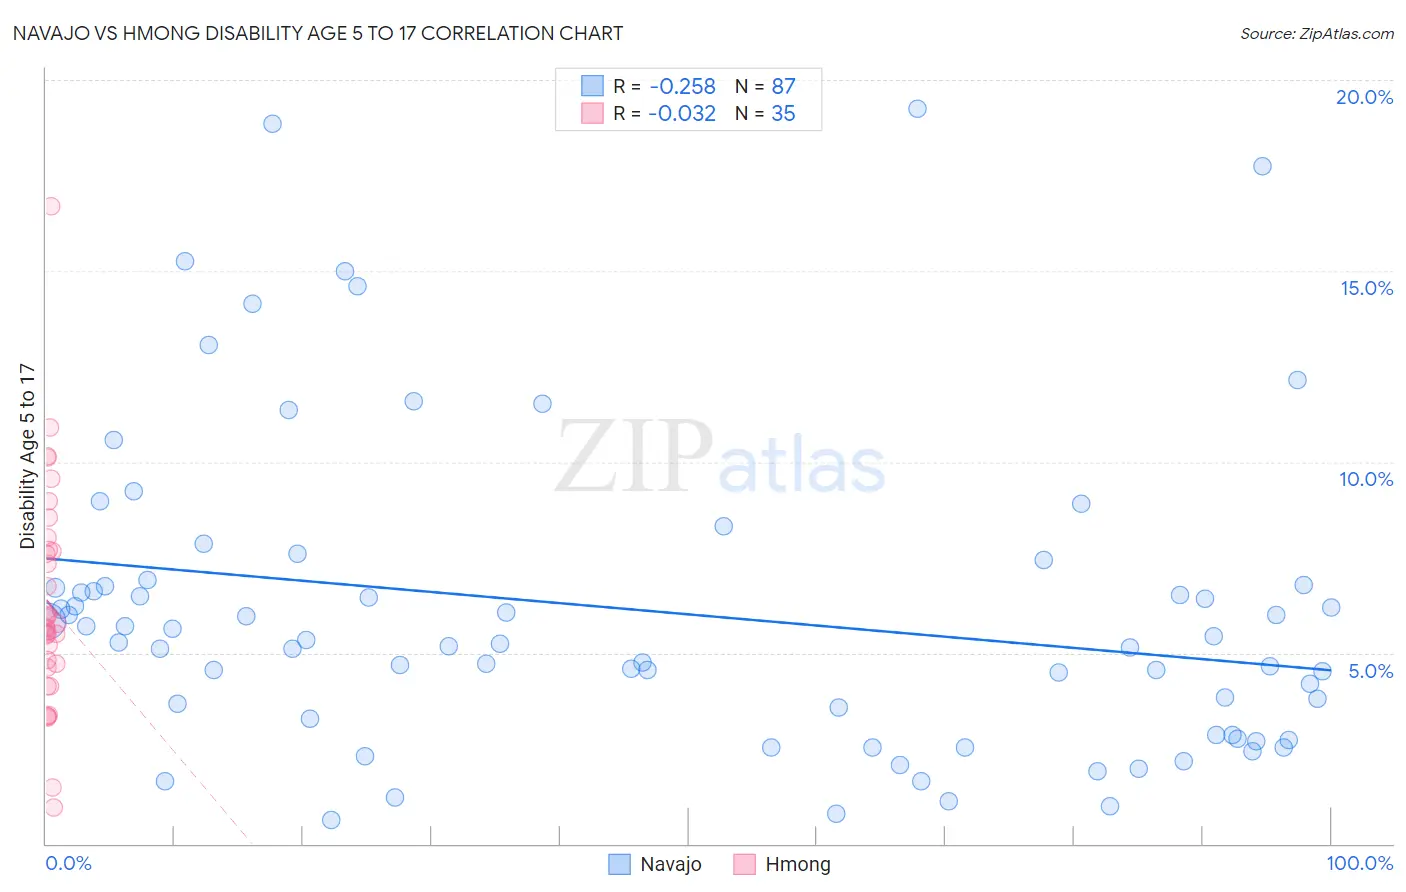
Navajo vs Hmong Disability Age 5 to 17 Correlation Chart
The statistical analysis conducted on geographies consisting of 223,670,452 people shows a weak negative correlation between the proportion of Navajo and percentage of population with a disability between the ages 5 and 17 in the United States with a correlation coefficient (R) of -0.258 and weighted average of 5.4%. Similarly, the statistical analysis conducted on geographies consisting of 24,665,493 people shows no correlation between the proportion of Hmong and percentage of population with a disability between the ages 5 and 17 in the United States with a correlation coefficient (R) of -0.032 and weighted average of 6.3%, a difference of 16.5%.
Disability Age 5 to 17 Correlation Summary
| Measurement | Navajo | Hmong |
| Minimum | 0.63% | 0.96% |
| Maximum | 19.3% | 16.7% |
| Range | 18.6% | 15.7% |
| Mean | 6.1% | 6.3% |
| Median | 5.3% | 5.7% |
| Interquartile 25% (IQ1) | 2.8% | 4.6% |
| Interquartile 75% (IQ3) | 6.8% | 7.7% |
| Interquartile Range (IQR) | 3.9% | 3.1% |
| Standard Deviation (Sample) | 4.1% | 3.0% |
| Standard Deviation (Population) | 4.1% | 2.9% |
Similar Demographics by Disability Age 5 to 17
Demographics Similar to Navajo by Disability Age 5 to 17
In terms of disability age 5 to 17, the demographic groups most similar to Navajo are Immigrants from Oceania (5.4%, a difference of 0.0%), Belizean (5.4%, a difference of 0.010%), Immigrants from Netherlands (5.4%, a difference of 0.060%), Immigrants from Denmark (5.4%, a difference of 0.080%), and Immigrants from Belize (5.4%, a difference of 0.13%).
| Demographics | Rating | Rank | Disability Age 5 to 17 |
| Immigrants | Bulgaria | 94.0 /100 | #130 | Exceptional 5.4% |
| Arabs | 92.9 /100 | #131 | Exceptional 5.4% |
| Immigrants | Colombia | 92.9 /100 | #132 | Exceptional 5.4% |
| Venezuelans | 92.7 /100 | #133 | Exceptional 5.4% |
| Yuman | 92.3 /100 | #134 | Exceptional 5.4% |
| Immigrants | Belize | 91.7 /100 | #135 | Exceptional 5.4% |
| Immigrants | Denmark | 91.4 /100 | #136 | Exceptional 5.4% |
| Navajo | 90.9 /100 | #137 | Exceptional 5.4% |
| Immigrants | Oceania | 90.8 /100 | #138 | Exceptional 5.4% |
| Belizeans | 90.8 /100 | #139 | Exceptional 5.4% |
| Immigrants | Netherlands | 90.5 /100 | #140 | Exceptional 5.4% |
| South American Indians | 89.3 /100 | #141 | Excellent 5.5% |
| Colombians | 88.0 /100 | #142 | Excellent 5.5% |
| Immigrants | Hungary | 87.9 /100 | #143 | Excellent 5.5% |
| Pakistanis | 87.3 /100 | #144 | Excellent 5.5% |
Demographics Similar to Hmong by Disability Age 5 to 17
In terms of disability age 5 to 17, the demographic groups most similar to Hmong are Scotch-Irish (6.3%, a difference of 0.020%), Alaskan Athabascan (6.3%, a difference of 0.13%), Immigrants from Dominica (6.3%, a difference of 0.18%), Bahamian (6.3%, a difference of 0.26%), and Bermudan (6.4%, a difference of 0.29%).
| Demographics | Rating | Rank | Disability Age 5 to 17 |
| Celtics | 0.0 /100 | #302 | Tragic 6.3% |
| Yakama | 0.0 /100 | #303 | Tragic 6.3% |
| Senegalese | 0.0 /100 | #304 | Tragic 6.3% |
| Natives/Alaskans | 0.0 /100 | #305 | Tragic 6.3% |
| Immigrants | Nonimmigrants | 0.0 /100 | #306 | Tragic 6.3% |
| Bahamians | 0.0 /100 | #307 | Tragic 6.3% |
| Scotch-Irish | 0.0 /100 | #308 | Tragic 6.3% |
| Hmong | 0.0 /100 | #309 | Tragic 6.3% |
| Alaskan Athabascans | 0.0 /100 | #310 | Tragic 6.3% |
| Immigrants | Dominica | 0.0 /100 | #311 | Tragic 6.3% |
| Bermudans | 0.0 /100 | #312 | Tragic 6.4% |
| Apache | 0.0 /100 | #313 | Tragic 6.4% |
| French | 0.0 /100 | #314 | Tragic 6.4% |
| Immigrants | Portugal | 0.0 /100 | #315 | Tragic 6.4% |
| Immigrants | Dominican Republic | 0.0 /100 | #316 | Tragic 6.4% |