Ukrainian vs Hmong Disability Age 5 to 17
COMPARE
Ukrainian
Hmong
Disability Age 5 to 17
Disability Age 5 to 17 Comparison
Ukrainians
Hmong
5.6%
DISABILITY AGE 5 TO 17
51.5/ 100
METRIC RATING
172nd/ 347
METRIC RANK
6.3%
DISABILITY AGE 5 TO 17
0.0/ 100
METRIC RATING
309th/ 347
METRIC RANK
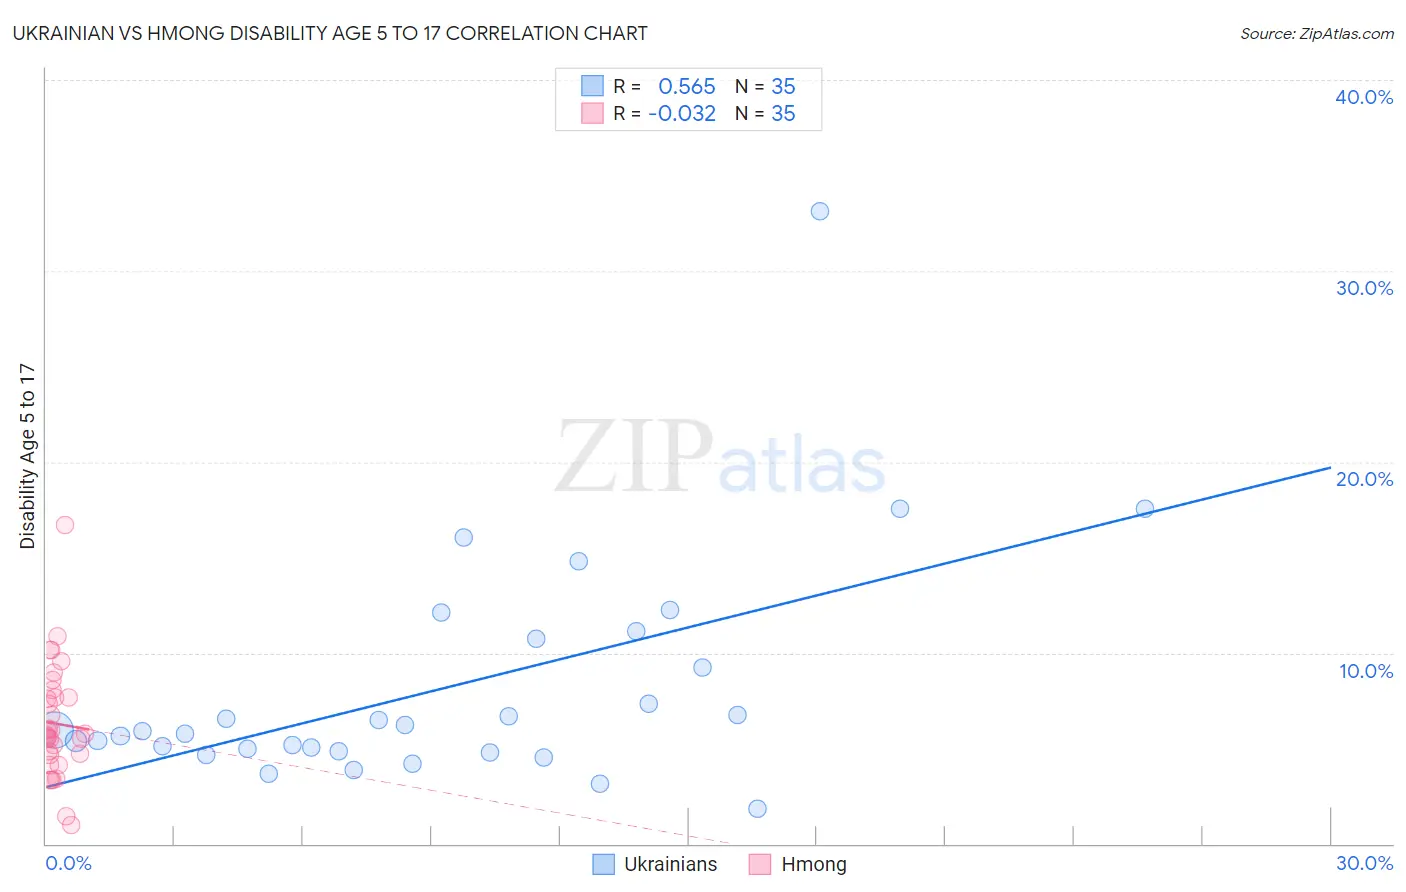
Ukrainian vs Hmong Disability Age 5 to 17 Correlation Chart
The statistical analysis conducted on geographies consisting of 442,807,363 people shows a substantial positive correlation between the proportion of Ukrainians and percentage of population with a disability between the ages 5 and 17 in the United States with a correlation coefficient (R) of 0.565 and weighted average of 5.6%. Similarly, the statistical analysis conducted on geographies consisting of 24,665,493 people shows no correlation between the proportion of Hmong and percentage of population with a disability between the ages 5 and 17 in the United States with a correlation coefficient (R) of -0.032 and weighted average of 6.3%, a difference of 13.3%.
Disability Age 5 to 17 Correlation Summary
| Measurement | Ukrainian | Hmong |
| Minimum | 1.8% | 0.96% |
| Maximum | 33.1% | 16.7% |
| Range | 31.3% | 15.7% |
| Mean | 8.1% | 6.3% |
| Median | 5.9% | 5.7% |
| Interquartile 25% (IQ1) | 4.8% | 4.6% |
| Interquartile 75% (IQ3) | 10.7% | 7.7% |
| Interquartile Range (IQR) | 5.9% | 3.1% |
| Standard Deviation (Sample) | 6.0% | 3.0% |
| Standard Deviation (Population) | 5.9% | 2.9% |
Similar Demographics by Disability Age 5 to 17
Demographics Similar to Ukrainians by Disability Age 5 to 17
In terms of disability age 5 to 17, the demographic groups most similar to Ukrainians are Uruguayan (5.6%, a difference of 0.030%), Costa Rican (5.6%, a difference of 0.080%), Shoshone (5.6%, a difference of 0.10%), Immigrants from Central America (5.6%, a difference of 0.11%), and Serbian (5.6%, a difference of 0.12%).
| Demographics | Rating | Rank | Disability Age 5 to 17 |
| Lebanese | 61.4 /100 | #165 | Good 5.6% |
| Greeks | 60.6 /100 | #166 | Good 5.6% |
| Immigrants | Burma/Myanmar | 59.3 /100 | #167 | Average 5.6% |
| Iraqis | 56.0 /100 | #168 | Average 5.6% |
| Immigrants | Norway | 55.7 /100 | #169 | Average 5.6% |
| Serbians | 54.0 /100 | #170 | Average 5.6% |
| Immigrants | Iraq | 53.9 /100 | #171 | Average 5.6% |
| Ukrainians | 51.5 /100 | #172 | Average 5.6% |
| Uruguayans | 51.0 /100 | #173 | Average 5.6% |
| Costa Ricans | 50.0 /100 | #174 | Average 5.6% |
| Shoshone | 49.4 /100 | #175 | Average 5.6% |
| Immigrants | Central America | 49.4 /100 | #176 | Average 5.6% |
| Immigrants | Western Europe | 47.8 /100 | #177 | Average 5.6% |
| Immigrants | Trinidad and Tobago | 47.6 /100 | #178 | Average 5.6% |
| Immigrants | Barbados | 40.5 /100 | #179 | Average 5.6% |
Demographics Similar to Hmong by Disability Age 5 to 17
In terms of disability age 5 to 17, the demographic groups most similar to Hmong are Scotch-Irish (6.3%, a difference of 0.020%), Alaskan Athabascan (6.3%, a difference of 0.13%), Immigrants from Dominica (6.3%, a difference of 0.18%), Bahamian (6.3%, a difference of 0.26%), and Bermudan (6.4%, a difference of 0.29%).
| Demographics | Rating | Rank | Disability Age 5 to 17 |
| Celtics | 0.0 /100 | #302 | Tragic 6.3% |
| Yakama | 0.0 /100 | #303 | Tragic 6.3% |
| Senegalese | 0.0 /100 | #304 | Tragic 6.3% |
| Natives/Alaskans | 0.0 /100 | #305 | Tragic 6.3% |
| Immigrants | Nonimmigrants | 0.0 /100 | #306 | Tragic 6.3% |
| Bahamians | 0.0 /100 | #307 | Tragic 6.3% |
| Scotch-Irish | 0.0 /100 | #308 | Tragic 6.3% |
| Hmong | 0.0 /100 | #309 | Tragic 6.3% |
| Alaskan Athabascans | 0.0 /100 | #310 | Tragic 6.3% |
| Immigrants | Dominica | 0.0 /100 | #311 | Tragic 6.3% |
| Bermudans | 0.0 /100 | #312 | Tragic 6.4% |
| Apache | 0.0 /100 | #313 | Tragic 6.4% |
| French | 0.0 /100 | #314 | Tragic 6.4% |
| Immigrants | Portugal | 0.0 /100 | #315 | Tragic 6.4% |
| Immigrants | Dominican Republic | 0.0 /100 | #316 | Tragic 6.4% |