West Indian vs Immigrants from West Indies Disability Age 5 to 17
COMPARE
West Indian
Immigrants from West Indies
Disability Age 5 to 17
Disability Age 5 to 17 Comparison
West Indians
Immigrants from West Indies
5.9%
DISABILITY AGE 5 TO 17
2.4/ 100
METRIC RATING
240th/ 347
METRIC RANK
5.8%
DISABILITY AGE 5 TO 17
3.5/ 100
METRIC RATING
233rd/ 347
METRIC RANK
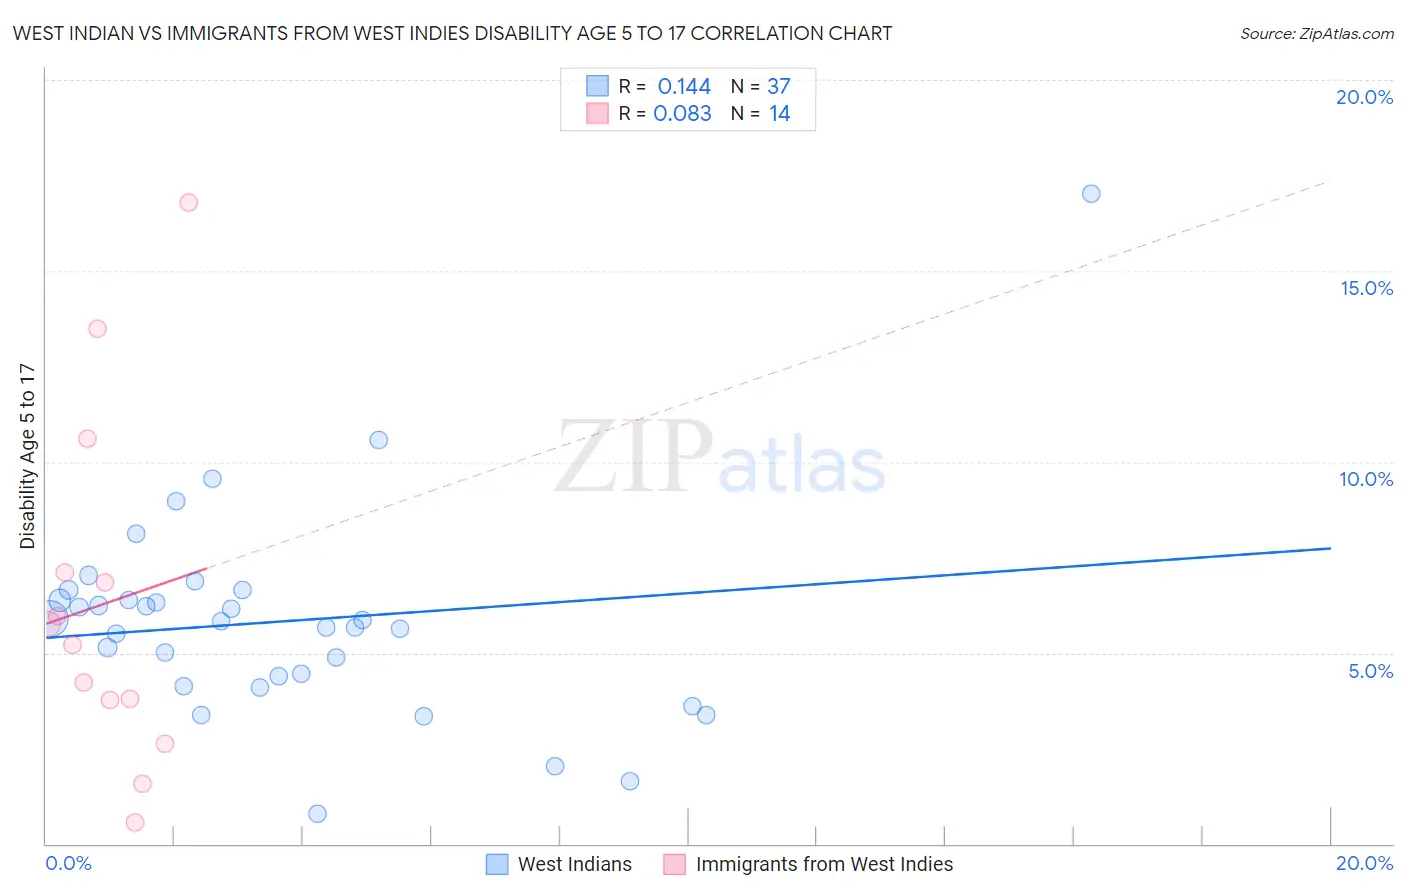
West Indian vs Immigrants from West Indies Disability Age 5 to 17 Correlation Chart
The statistical analysis conducted on geographies consisting of 253,061,388 people shows a poor positive correlation between the proportion of West Indians and percentage of population with a disability between the ages 5 and 17 in the United States with a correlation coefficient (R) of 0.144 and weighted average of 5.9%. Similarly, the statistical analysis conducted on geographies consisting of 72,374,754 people shows a slight positive correlation between the proportion of Immigrants from West Indies and percentage of population with a disability between the ages 5 and 17 in the United States with a correlation coefficient (R) of 0.083 and weighted average of 5.8%, a difference of 0.49%.
Disability Age 5 to 17 Correlation Summary
| Measurement | West Indian | Immigrants from West Indies |
| Minimum | 0.79% | 0.57% |
| Maximum | 17.0% | 16.8% |
| Range | 16.2% | 16.2% |
| Mean | 5.8% | 6.3% |
| Median | 5.8% | 5.5% |
| Interquartile 25% (IQ1) | 4.3% | 3.8% |
| Interquartile 75% (IQ3) | 6.5% | 7.1% |
| Interquartile Range (IQR) | 2.3% | 3.3% |
| Standard Deviation (Sample) | 2.8% | 4.5% |
| Standard Deviation (Population) | 2.7% | 4.4% |
Demographics Similar to West Indians and Immigrants from West Indies by Disability Age 5 to 17
In terms of disability age 5 to 17, the demographic groups most similar to West Indians are German Russian (5.9%, a difference of 0.020%), Hungarian (5.8%, a difference of 0.12%), Immigrants from Caribbean (5.9%, a difference of 0.13%), Spaniard (5.9%, a difference of 0.21%), and Sudanese (5.8%, a difference of 0.22%). Similarly, the demographic groups most similar to Immigrants from West Indies are Immigrants from Kenya (5.8%, a difference of 0.040%), Malaysian (5.8%, a difference of 0.050%), Immigrants from Laos (5.8%, a difference of 0.090%), Immigrants from Brazil (5.8%, a difference of 0.11%), and Sudanese (5.8%, a difference of 0.26%).
| Demographics | Rating | Rank | Disability Age 5 to 17 |
| British West Indians | 5.4 /100 | #226 | Tragic 5.8% |
| Swiss | 5.1 /100 | #227 | Tragic 5.8% |
| Haitians | 4.8 /100 | #228 | Tragic 5.8% |
| Bangladeshis | 4.8 /100 | #229 | Tragic 5.8% |
| Ghanaians | 4.7 /100 | #230 | Tragic 5.8% |
| Europeans | 4.5 /100 | #231 | Tragic 5.8% |
| Immigrants | Laos | 3.8 /100 | #232 | Tragic 5.8% |
| Immigrants | West Indies | 3.5 /100 | #233 | Tragic 5.8% |
| Immigrants | Kenya | 3.4 /100 | #234 | Tragic 5.8% |
| Malaysians | 3.4 /100 | #235 | Tragic 5.8% |
| Immigrants | Brazil | 3.2 /100 | #236 | Tragic 5.8% |
| Sudanese | 2.9 /100 | #237 | Tragic 5.8% |
| Hungarians | 2.6 /100 | #238 | Tragic 5.8% |
| German Russians | 2.4 /100 | #239 | Tragic 5.9% |
| West Indians | 2.4 /100 | #240 | Tragic 5.9% |
| Immigrants | Caribbean | 2.1 /100 | #241 | Tragic 5.9% |
| Spaniards | 2.0 /100 | #242 | Tragic 5.9% |
| Indonesians | 2.0 /100 | #243 | Tragic 5.9% |
| Immigrants | Germany | 1.9 /100 | #244 | Tragic 5.9% |
| Immigrants | Micronesia | 1.9 /100 | #245 | Tragic 5.9% |
| Tlingit-Haida | 1.9 /100 | #246 | Tragic 5.9% |