Arab vs Immigrants from Eastern Africa Disability Age Under 5
COMPARE
Arab
Immigrants from Eastern Africa
Disability Age Under 5
Disability Age Under 5 Comparison
Arabs
Immigrants from Eastern Africa
1.2%
DISABILITY AGE UNDER 5
66.4/ 100
METRIC RATING
158th/ 347
METRIC RANK
1.2%
DISABILITY AGE UNDER 5
83.1/ 100
METRIC RATING
137th/ 347
METRIC RANK
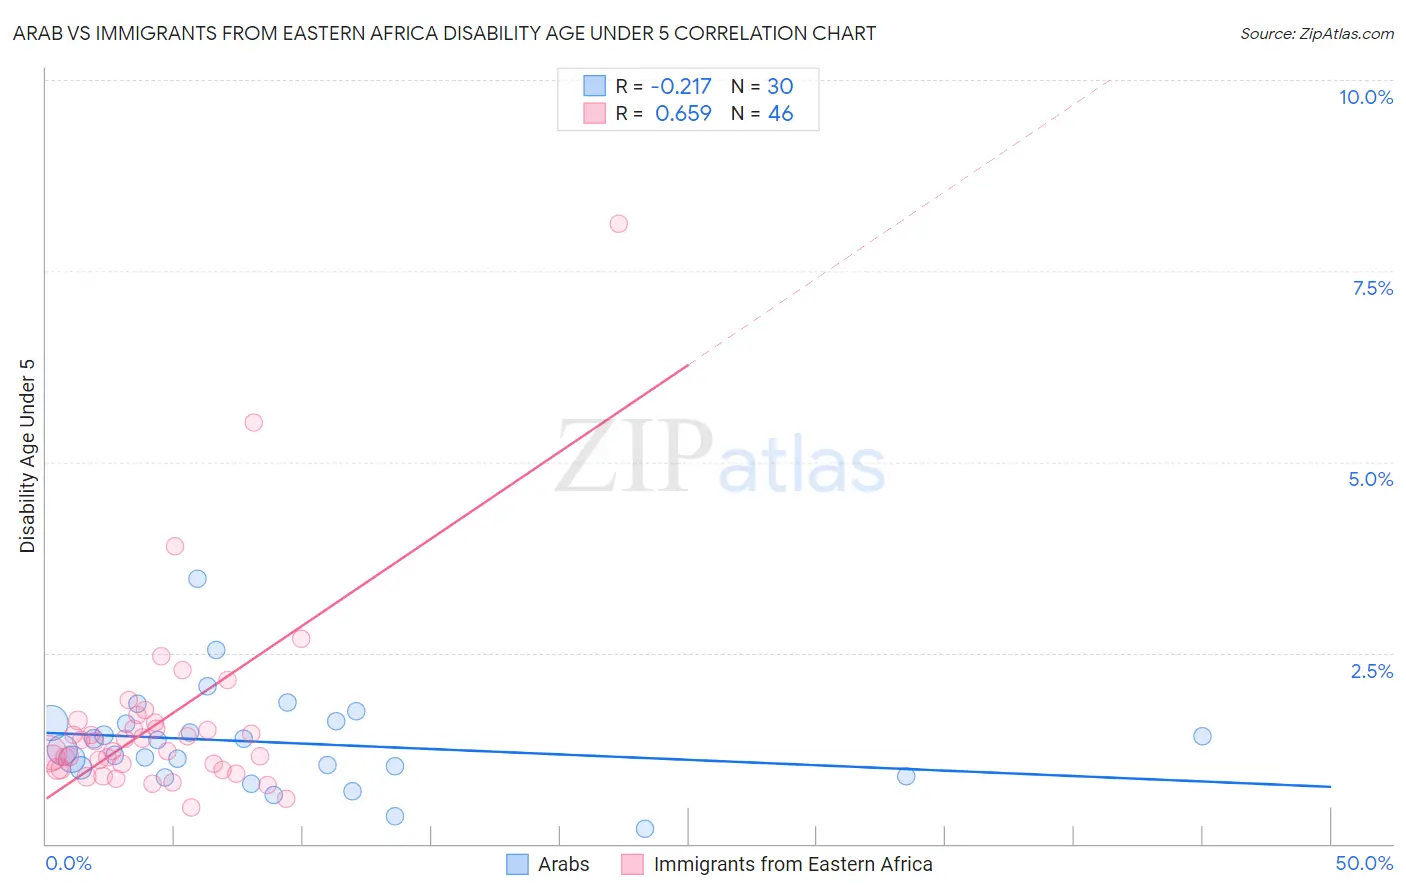
Arab vs Immigrants from Eastern Africa Disability Age Under 5 Correlation Chart
The statistical analysis conducted on geographies consisting of 244,671,957 people shows a weak negative correlation between the proportion of Arabs and percentage of population with a disability under the age of 5 in the United States with a correlation coefficient (R) of -0.217 and weighted average of 1.2%. Similarly, the statistical analysis conducted on geographies consisting of 202,266,724 people shows a significant positive correlation between the proportion of Immigrants from Eastern Africa and percentage of population with a disability under the age of 5 in the United States with a correlation coefficient (R) of 0.659 and weighted average of 1.2%, a difference of 2.1%.
Disability Age Under 5 Correlation Summary
| Measurement | Arab | Immigrants from Eastern Africa |
| Minimum | 0.20% | 0.48% |
| Maximum | 3.5% | 8.1% |
| Range | 3.3% | 7.6% |
| Mean | 1.3% | 1.6% |
| Median | 1.3% | 1.3% |
| Interquartile 25% (IQ1) | 0.99% | 0.98% |
| Interquartile 75% (IQ3) | 1.6% | 1.6% |
| Interquartile Range (IQR) | 0.59% | 0.60% |
| Standard Deviation (Sample) | 0.64% | 1.3% |
| Standard Deviation (Population) | 0.63% | 1.3% |
Similar Demographics by Disability Age Under 5
Demographics Similar to Arabs by Disability Age Under 5
In terms of disability age under 5, the demographic groups most similar to Arabs are Immigrants from South America (1.2%, a difference of 0.060%), Colombian (1.2%, a difference of 0.060%), Immigrants from Latin America (1.2%, a difference of 0.060%), Immigrants from Africa (1.2%, a difference of 0.13%), and Hawaiian (1.2%, a difference of 0.22%).
| Demographics | Rating | Rank | Disability Age Under 5 |
| Yaqui | 74.8 /100 | #151 | Good 1.2% |
| Hondurans | 72.5 /100 | #152 | Good 1.2% |
| Immigrants | Thailand | 69.4 /100 | #153 | Good 1.2% |
| Uruguayans | 68.8 /100 | #154 | Good 1.2% |
| Immigrants | Ghana | 68.7 /100 | #155 | Good 1.2% |
| Hawaiians | 68.5 /100 | #156 | Good 1.2% |
| Immigrants | South America | 67.0 /100 | #157 | Good 1.2% |
| Arabs | 66.4 /100 | #158 | Good 1.2% |
| Colombians | 65.8 /100 | #159 | Good 1.2% |
| Immigrants | Latin America | 65.8 /100 | #160 | Good 1.2% |
| Immigrants | Africa | 65.1 /100 | #161 | Good 1.2% |
| Guatemalans | 63.6 /100 | #162 | Good 1.2% |
| Immigrants | Guatemala | 63.2 /100 | #163 | Good 1.2% |
| Laotians | 62.8 /100 | #164 | Good 1.2% |
| Immigrants | Kuwait | 62.6 /100 | #165 | Good 1.2% |
Demographics Similar to Immigrants from Eastern Africa by Disability Age Under 5
In terms of disability age under 5, the demographic groups most similar to Immigrants from Eastern Africa are Immigrants from Czechoslovakia (1.2%, a difference of 0.050%), Moroccan (1.2%, a difference of 0.090%), Fijian (1.2%, a difference of 0.27%), New Zealander (1.2%, a difference of 0.28%), and Somali (1.2%, a difference of 0.37%).
| Demographics | Rating | Rank | Disability Age Under 5 |
| Koreans | 87.7 /100 | #130 | Excellent 1.2% |
| Immigrants | Serbia | 87.6 /100 | #131 | Excellent 1.2% |
| Immigrants | Eastern Europe | 87.3 /100 | #132 | Excellent 1.2% |
| Immigrants | Spain | 86.5 /100 | #133 | Excellent 1.2% |
| Argentineans | 85.7 /100 | #134 | Excellent 1.2% |
| Fijians | 84.7 /100 | #135 | Excellent 1.2% |
| Moroccans | 83.6 /100 | #136 | Excellent 1.2% |
| Immigrants | Eastern Africa | 83.1 /100 | #137 | Excellent 1.2% |
| Immigrants | Czechoslovakia | 82.8 /100 | #138 | Excellent 1.2% |
| New Zealanders | 81.4 /100 | #139 | Excellent 1.2% |
| Somalis | 80.8 /100 | #140 | Excellent 1.2% |
| Immigrants | Honduras | 80.4 /100 | #141 | Excellent 1.2% |
| Immigrants | Colombia | 79.3 /100 | #142 | Good 1.2% |
| Alsatians | 79.3 /100 | #143 | Good 1.2% |
| Immigrants | Middle Africa | 79.3 /100 | #144 | Good 1.2% |