Sioux vs Immigrants from Eastern Africa Disability Age Under 5
COMPARE
Sioux
Immigrants from Eastern Africa
Disability Age Under 5
Disability Age Under 5 Comparison
Sioux
Immigrants from Eastern Africa
1.8%
DISABILITY AGE UNDER 5
0.0/ 100
METRIC RATING
326th/ 347
METRIC RANK
1.2%
DISABILITY AGE UNDER 5
83.1/ 100
METRIC RATING
137th/ 347
METRIC RANK
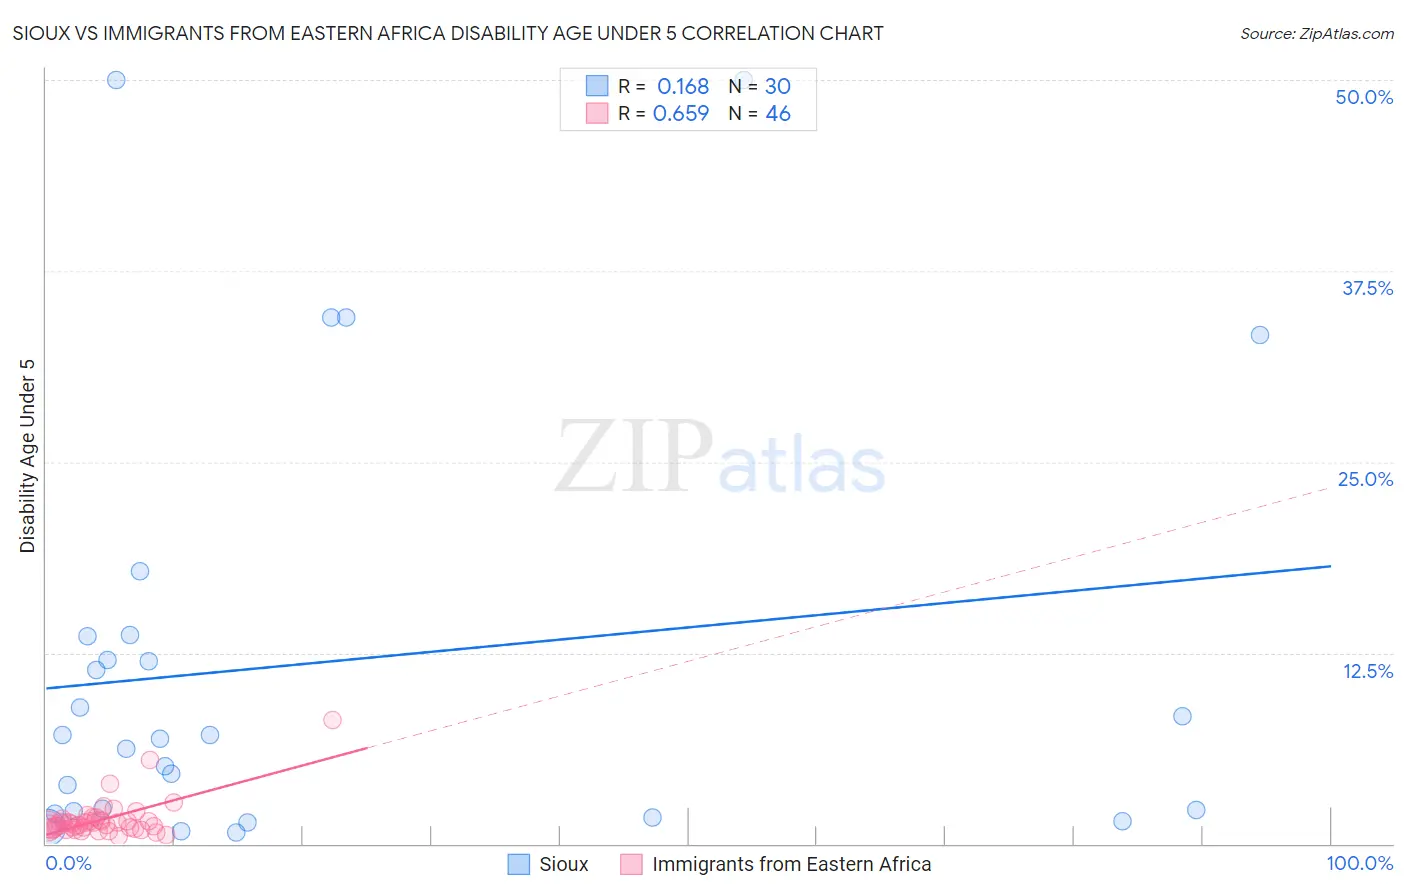
Sioux vs Immigrants from Eastern Africa Disability Age Under 5 Correlation Chart
The statistical analysis conducted on geographies consisting of 151,129,395 people shows a poor positive correlation between the proportion of Sioux and percentage of population with a disability under the age of 5 in the United States with a correlation coefficient (R) of 0.168 and weighted average of 1.8%. Similarly, the statistical analysis conducted on geographies consisting of 202,266,724 people shows a significant positive correlation between the proportion of Immigrants from Eastern Africa and percentage of population with a disability under the age of 5 in the United States with a correlation coefficient (R) of 0.659 and weighted average of 1.2%, a difference of 52.3%.
Disability Age Under 5 Correlation Summary
| Measurement | Sioux | Immigrants from Eastern Africa |
| Minimum | 0.72% | 0.48% |
| Maximum | 50.0% | 8.1% |
| Range | 49.3% | 7.6% |
| Mean | 11.9% | 1.6% |
| Median | 7.0% | 1.3% |
| Interquartile 25% (IQ1) | 2.1% | 0.98% |
| Interquartile 75% (IQ3) | 13.6% | 1.6% |
| Interquartile Range (IQR) | 11.5% | 0.60% |
| Standard Deviation (Sample) | 14.1% | 1.3% |
| Standard Deviation (Population) | 13.9% | 1.3% |
Similar Demographics by Disability Age Under 5
Demographics Similar to Sioux by Disability Age Under 5
In terms of disability age under 5, the demographic groups most similar to Sioux are Osage (1.8%, a difference of 0.39%), Immigrants from Portugal (1.8%, a difference of 1.4%), American (1.9%, a difference of 2.1%), Houma (1.9%, a difference of 2.6%), and Cherokee (1.8%, a difference of 2.8%).
| Demographics | Rating | Rank | Disability Age Under 5 |
| Slovaks | 0.0 /100 | #319 | Tragic 1.7% |
| Scotch-Irish | 0.0 /100 | #320 | Tragic 1.7% |
| Ottawa | 0.0 /100 | #321 | Tragic 1.7% |
| Germans | 0.0 /100 | #322 | Tragic 1.7% |
| Chickasaw | 0.0 /100 | #323 | Tragic 1.7% |
| Cherokee | 0.0 /100 | #324 | Tragic 1.8% |
| Immigrants | Portugal | 0.0 /100 | #325 | Tragic 1.8% |
| Sioux | 0.0 /100 | #326 | Tragic 1.8% |
| Osage | 0.0 /100 | #327 | Tragic 1.8% |
| Americans | 0.0 /100 | #328 | Tragic 1.9% |
| Houma | 0.0 /100 | #329 | Tragic 1.9% |
| Choctaw | 0.0 /100 | #330 | Tragic 1.9% |
| French Canadians | 0.0 /100 | #331 | Tragic 1.9% |
| Chippewa | 0.0 /100 | #332 | Tragic 1.9% |
| Dutch West Indians | 0.0 /100 | #333 | Tragic 1.9% |
Demographics Similar to Immigrants from Eastern Africa by Disability Age Under 5
In terms of disability age under 5, the demographic groups most similar to Immigrants from Eastern Africa are Immigrants from Czechoslovakia (1.2%, a difference of 0.050%), Moroccan (1.2%, a difference of 0.090%), Fijian (1.2%, a difference of 0.27%), New Zealander (1.2%, a difference of 0.28%), and Somali (1.2%, a difference of 0.37%).
| Demographics | Rating | Rank | Disability Age Under 5 |
| Koreans | 87.7 /100 | #130 | Excellent 1.2% |
| Immigrants | Serbia | 87.6 /100 | #131 | Excellent 1.2% |
| Immigrants | Eastern Europe | 87.3 /100 | #132 | Excellent 1.2% |
| Immigrants | Spain | 86.5 /100 | #133 | Excellent 1.2% |
| Argentineans | 85.7 /100 | #134 | Excellent 1.2% |
| Fijians | 84.7 /100 | #135 | Excellent 1.2% |
| Moroccans | 83.6 /100 | #136 | Excellent 1.2% |
| Immigrants | Eastern Africa | 83.1 /100 | #137 | Excellent 1.2% |
| Immigrants | Czechoslovakia | 82.8 /100 | #138 | Excellent 1.2% |
| New Zealanders | 81.4 /100 | #139 | Excellent 1.2% |
| Somalis | 80.8 /100 | #140 | Excellent 1.2% |
| Immigrants | Honduras | 80.4 /100 | #141 | Excellent 1.2% |
| Immigrants | Colombia | 79.3 /100 | #142 | Good 1.2% |
| Alsatians | 79.3 /100 | #143 | Good 1.2% |
| Immigrants | Middle Africa | 79.3 /100 | #144 | Good 1.2% |