Turkish vs Slovak Professional Degree

COMPARE

Turkish
Race
Ancestry
AfghanAfricanAlaska NativeAlaskan AthabascanAlbanianAleutAlsatianAmericanApacheArabArapahoArgentineanArmenianAssyrian/Chaldean/SyriacAustralianAustrianBahamianBangladeshiBarbadianBasqueBelgianBelizeanBermudanBhutaneseBlackfeetBolivianBrazilianBritishBritish West IndianBulgarianBurmeseCajunCambodianCanadianCape VerdeanCarpatho RusynCelticCentral AmericanCentral American IndianCherokeeCheyenneChickasawChileanChineseChippewaChoctawColombianColvilleComancheCosta RicanCreeCreekCroatianCrowCubanCypriotCzechCzechoslovakianDanishDelawareDominicanDutchDutch West IndianEastern EuropeanEcuadorianEgyptianEnglishEstonianEthiopianEuropeanFijianFilipinoFinnishFrenchFrench American IndianFrench CanadianGermanGerman RussianGhanaianGreekGuamanian/ChamorroGuatemalanGuyaneseHaitianHmongHonduranHopiHoumaHungarianIcelanderIndian (Asian)IndonesianInupiatIranianIraqiIrishIroquoisIsraeliItalianJamaicanJapaneseJordanianKenyanKiowaKoreanLaotianLatvianLebaneseLiberianLithuanianLumbeeLuxembourgerMacedonianMalaysianMalteseMarshalleseMenomineeMexicanMexican American IndianMongolianMoroccanNative HawaiianNavajoNepaleseNew ZealanderNicaraguanNigerianNorthern EuropeanNorwegianOkinawanOsageOttawaPaiutePakistaniPalestinianPanamanianParaguayanPennsylvania GermanPeruvianPimaPolishPortuguesePotawatomiPuebloPuerto RicanPuget Sound SalishRomanianRussianSalvadoranSamoanScandinavianScotch-IrishScottishSeminoleSenegaleseSerbianShoshoneSierra LeoneanSiouxSlavicSloveneSomaliSouth AfricanSouth AmericanSouth American IndianSoviet UnionSpaniardSpanishSpanish AmericanSpanish American IndianSri LankanSubsaharan AfricanSudaneseSwedishSwissSyrianTaiwaneseThaiTlingit-HaidaTohono O'OdhamTonganTrinidadian and TobagonianTsimshianTurkishU.S. Virgin IslanderUgandanUkrainianUruguayanUteVenezuelanVietnameseWelshWest IndianYakamaYaquiYugoslavianYumanYup'ikZimbabwean
Immigration
NonimmigrantsImmigrantsAfghanistanAfricaAlbaniaArgentinaArmeniaAsiaAustraliaAustriaBahamasBangladeshBarbadosBelarusBelgiumBelizeBoliviaBosnia and HerzegovinaBrazilBulgariaBurma/MyanmarCabo VerdeCambodiaCameroonCanadaCaribbeanCentral AmericaChileChinaColombiaCongoCosta RicaCroatiaCubaCzechoslovakiaDenmarkDominicaDominican RepublicEastern AfricaEastern AsiaEastern EuropeEcuadorEgyptEl SalvadorEnglandEritreaEthiopiaEuropeFijiFranceGermanyGhanaGreeceGrenadaGuatemalaGuyanaHaitiHondurasHong KongHungaryIndiaIndonesiaIranIraqIrelandIsraelItalyJamaicaJapanJordanKazakhstanKenyaKoreaKuwaitLaosLatin AmericaLatviaLebanonLiberiaLithuaniaMalaysiaMexicoMicronesiaMiddle AfricaMoldovaMoroccoNepalNetherlandsNicaraguaNigeriaNorth AmericaNorth MacedoniaNorthern AfricaNorthern EuropeNorwayOceaniaPakistanPanamaPeruPhilippinesPolandPortugalRomaniaRussiaSaudi ArabiaScotlandSenegalSerbiaSierra LeoneSingaporeSomaliaSouth AfricaSouth AmericaSouth Central AsiaSouth Eastern AsiaSouthern EuropeSpainSri LankaSt. Vincent and the GrenadinesSudanSwedenSwitzerlandSyriaTaiwanThailandTrinidad and TobagoTurkeyUgandaUkraineUruguayUzbekistanVenezuelaVietnamWest IndiesWestern AfricaWestern AsiaWestern EuropeYemenZaireZimbabweAzores
Slovak
Race
Ancestry
AfghanAfricanAlaska NativeAlaskan AthabascanAlbanianAleutAlsatianAmericanApacheArabArapahoArgentineanArmenianAssyrian/Chaldean/SyriacAustralianAustrianBahamianBangladeshiBarbadianBasqueBelgianBelizeanBermudanBhutaneseBlackfeetBolivianBrazilianBritishBritish West IndianBulgarianBurmeseCajunCambodianCanadianCape VerdeanCarpatho RusynCelticCentral AmericanCentral American IndianCherokeeCheyenneChickasawChileanChineseChippewaChoctawColombianColvilleComancheCosta RicanCreeCreekCroatianCrowCubanCypriotCzechCzechoslovakianDanishDelawareDominicanDutchDutch West IndianEastern EuropeanEcuadorianEgyptianEnglishEstonianEthiopianEuropeanFijianFilipinoFinnishFrenchFrench American IndianFrench CanadianGermanGerman RussianGhanaianGreekGuamanian/ChamorroGuatemalanGuyaneseHaitianHmongHonduranHopiHoumaHungarianIcelanderIndian (Asian)IndonesianInupiatIranianIraqiIrishIroquoisIsraeliItalianJamaicanJapaneseJordanianKenyanKiowaKoreanLaotianLatvianLebaneseLiberianLithuanianLumbeeLuxembourgerMacedonianMalaysianMalteseMarshalleseMenomineeMexicanMexican American IndianMongolianMoroccanNative HawaiianNavajoNepaleseNew ZealanderNicaraguanNigerianNorthern EuropeanNorwegianOkinawanOsageOttawaPaiutePakistaniPalestinianPanamanianParaguayanPennsylvania GermanPeruvianPimaPolishPortuguesePotawatomiPuebloPuerto RicanPuget Sound SalishRomanianRussianSalvadoranSamoanScandinavianScotch-IrishScottishSeminoleSenegaleseSerbianShoshoneSierra LeoneanSiouxSlavicSlovakSloveneSomaliSouth AfricanSouth AmericanSouth American IndianSoviet UnionSpaniardSpanishSpanish AmericanSpanish American IndianSri LankanSubsaharan AfricanSudaneseSwedishSwissSyrianTaiwaneseThaiTlingit-HaidaTohono O'OdhamTonganTrinidadian and TobagonianTsimshianU.S. Virgin IslanderUgandanUkrainianUruguayanUteVenezuelanVietnameseWelshWest IndianYakamaYaquiYugoslavianYumanYup'ikZimbabwean
Immigration
NonimmigrantsImmigrantsAfghanistanAfricaAlbaniaArgentinaArmeniaAsiaAustraliaAustriaBahamasBangladeshBarbadosBelarusBelgiumBelizeBoliviaBosnia and HerzegovinaBrazilBulgariaBurma/MyanmarCabo VerdeCambodiaCameroonCanadaCaribbeanCentral AmericaChileChinaColombiaCongoCosta RicaCroatiaCubaCzechoslovakiaDenmarkDominicaDominican RepublicEastern AfricaEastern AsiaEastern EuropeEcuadorEgyptEl SalvadorEnglandEritreaEthiopiaEuropeFijiFranceGermanyGhanaGreeceGrenadaGuatemalaGuyanaHaitiHondurasHong KongHungaryIndiaIndonesiaIranIraqIrelandIsraelItalyJamaicaJapanJordanKazakhstanKenyaKoreaKuwaitLaosLatin AmericaLatviaLebanonLiberiaLithuaniaMalaysiaMexicoMicronesiaMiddle AfricaMoldovaMoroccoNepalNetherlandsNicaraguaNigeriaNorth AmericaNorth MacedoniaNorthern AfricaNorthern EuropeNorwayOceaniaPakistanPanamaPeruPhilippinesPolandPortugalRomaniaRussiaSaudi ArabiaScotlandSenegalSerbiaSierra LeoneSingaporeSomaliaSouth AfricaSouth AmericaSouth Central AsiaSouth Eastern AsiaSouthern EuropeSpainSri LankaSt. Vincent and the GrenadinesSudanSwedenSwitzerlandSyriaTaiwanThailandTrinidad and TobagoTurkeyUgandaUkraineUruguayUzbekistanVenezuelaVietnamWest IndiesWestern AfricaWestern AsiaWestern EuropeYemenZaireZimbabweAzores
Professional Degree
Income
Poverty
Unemployment
Labor Participation
Family Structure
Vehicle Availability
Education Level
Disability

Professional Degree Comparison

Turks

Slovaks

Exceptional
Fair
6.2%
PROFESSIONAL DEGREE
100.0/ 100
METRIC RATING
28th/ 347
METRIC RANK
4.3%
PROFESSIONAL DEGREE
30.7/ 100
METRIC RATING
189th/ 347
METRIC RANK

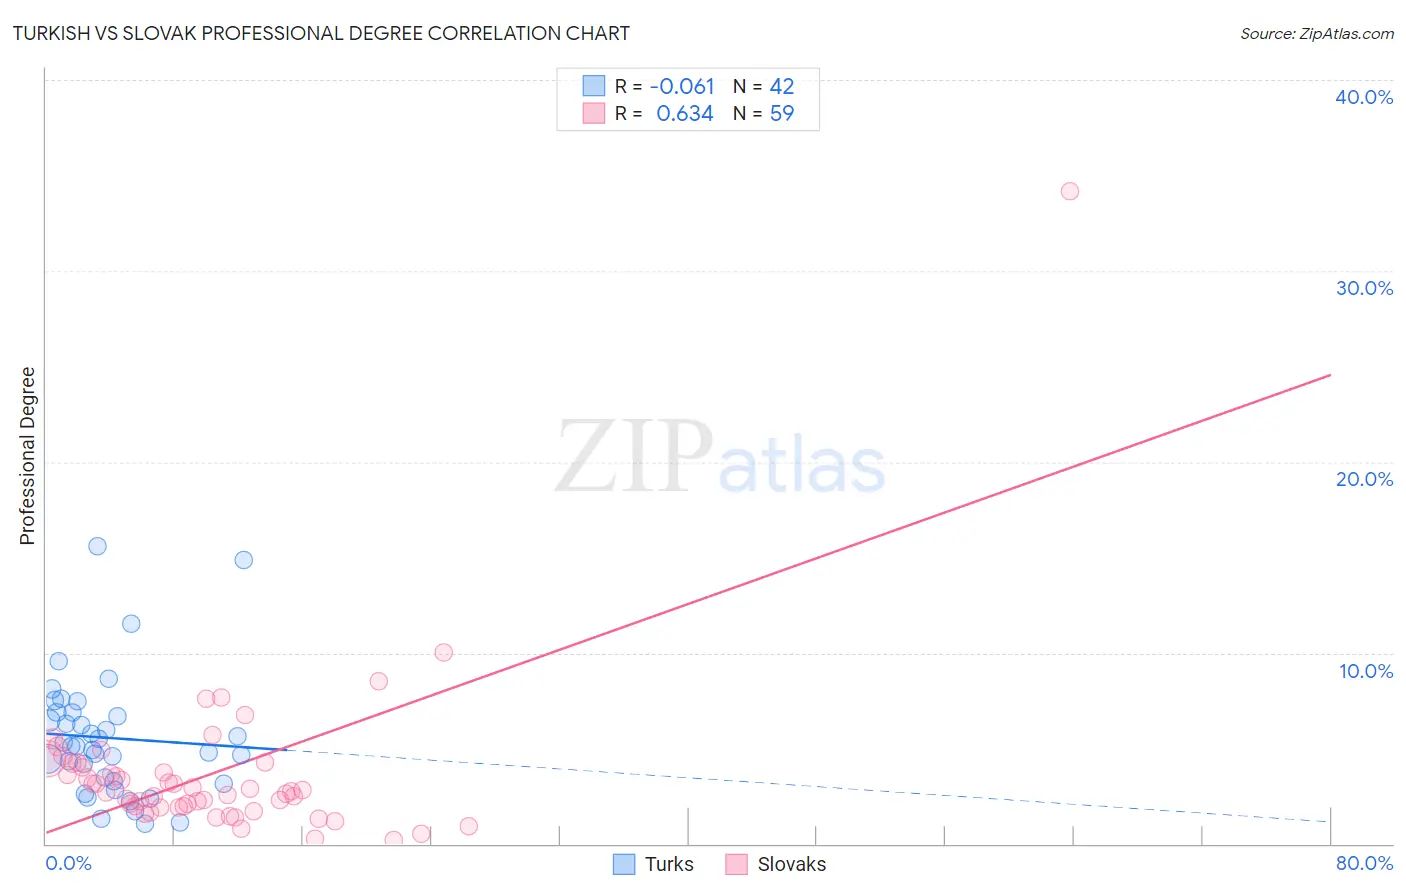
Turkish vs Slovak Professional Degree Correlation Chart

The statistical analysis conducted on geographies consisting of 271,613,931 people shows a slight negative correlation between the proportion of Turks and percentage of population with at least professional degree education in the United States with a correlation coefficient (R) of -0.061 and weighted average of 6.2%. Similarly, the statistical analysis conducted on geographies consisting of 396,603,912 people shows a significant positive correlation between the proportion of Slovaks and percentage of population with at least professional degree education in the United States with a correlation coefficient (R) of 0.634 and weighted average of 4.3%, a difference of 45.1%.
Turkish vs Slovak Professional Degree

Professional Degree Correlation Summary

MeasurementTurkishSlovak
Minimum1.0%0.17%
Maximum15.6%34.2%
Range14.5%34.0%
Mean5.5%3.7%
Median5.1%2.8%
Interquartile 25% (IQ1)3.3%1.9%
Interquartile 75% (IQ3)6.9%4.2%
Interquartile Range (IQR)3.6%2.3%
Standard Deviation (Sample)3.2%4.5%
Standard Deviation (Population)3.2%4.5%

Similar Demographics by Professional Degree

Demographics Similar to Turks by Professional Degree

In terms of professional degree, the demographic groups most similar to Turks are Immigrants from Northern Europe (6.2%, a difference of 0.11%), Latvian (6.2%, a difference of 0.62%), Immigrants from Sri Lanka (6.2%, a difference of 0.63%), Immigrants from Turkey (6.2%, a difference of 0.63%), and Immigrants from India (6.2%, a difference of 0.75%).
DemographicsRating | RankProfessional Degree
Immigrants | Hong Kong
100.0
/100
|
#21
Exceptional
6.4%
Immigrants | Japan
100.0
/100
|
#22
Exceptional
6.4%
Russians
100.0
/100
|
#23
Exceptional
6.3%
Immigrants | Spain
100.0
/100
|
#24
Exceptional
6.3%
Immigrants | Ireland
100.0
/100
|
#25
Exceptional
6.3%
Latvians
100.0
/100
|
#26
Exceptional
6.2%
Immigrants | Northern Europe
100.0
/100
|
#27
Exceptional
6.2%
Turks
100.0
/100
|
#28
Exceptional
6.2%
Immigrants | Sri Lanka
100.0
/100
|
#29
Exceptional
6.2%
Immigrants | Turkey
100.0
/100
|
#30
Exceptional
6.2%
Immigrants | India
100.0
/100
|
#31
Exceptional
6.2%
Thais
100.0
/100
|
#32
Exceptional
6.1%
Burmese
100.0
/100
|
#33
Exceptional
6.1%
Mongolians
100.0
/100
|
#34
Exceptional
6.1%
Immigrants | Korea
100.0
/100
|
#35
Exceptional
6.1%

Demographics Similar to Slovaks by Professional Degree

In terms of professional degree, the demographic groups most similar to Slovaks are Immigrants from Thailand (4.3%, a difference of 0.17%), Immigrants from Poland (4.3%, a difference of 0.26%), Sri Lankan (4.3%, a difference of 0.30%), Immigrants from Cameroon (4.3%, a difference of 0.45%), and Scotch-Irish (4.3%, a difference of 0.60%).
DemographicsRating | RankProfessional Degree
Immigrants | Immigrants
43.2
/100
|
#182
Average
4.4%
Bermudans
43.1
/100
|
#183
Average
4.4%
Belgians
36.2
/100
|
#184
Fair
4.3%
Welsh
35.8
/100
|
#185
Fair
4.3%
Scotch-Irish
34.2
/100
|
#186
Fair
4.3%
Immigrants | Cameroon
33.3
/100
|
#187
Fair
4.3%
Immigrants | Thailand
31.7
/100
|
#188
Fair
4.3%
Slovaks
30.7
/100
|
#189
Fair
4.3%
Immigrants | Poland
29.2
/100
|
#190
Fair
4.3%
Sri Lankans
29.0
/100
|
#191
Fair
4.3%
Ghanaians
27.3
/100
|
#192
Fair
4.3%
French
27.1
/100
|
#193
Fair
4.2%
Scandinavians
25.8
/100
|
#194
Fair
4.2%
Nigerians
24.6
/100
|
#195
Fair
4.2%
Spanish
23.0
/100
|
#196
Fair
4.2%