Immigrants from Syria vs Hispanic or Latino Self-Care Disability
COMPARE
Immigrants from Syria
Hispanic or Latino
Self-Care Disability
Self-Care Disability Comparison
Immigrants from Syria
Hispanics or Latinos
2.6%
SELF-CARE DISABILITY
1.0/ 100
METRIC RATING
241st/ 347
METRIC RANK
2.7%
SELF-CARE DISABILITY
0.1/ 100
METRIC RATING
280th/ 347
METRIC RANK
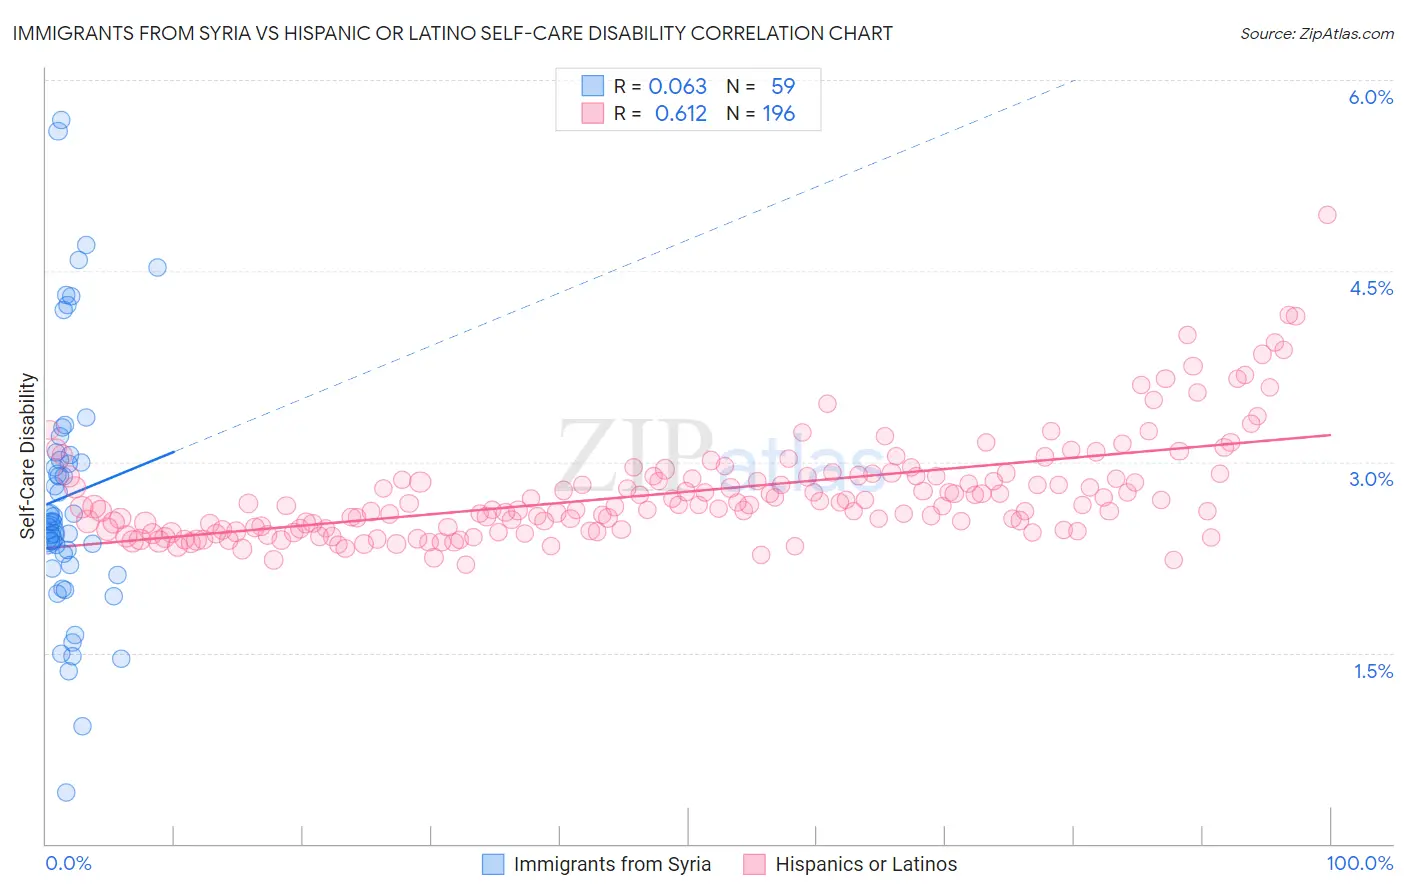
Immigrants from Syria vs Hispanic or Latino Self-Care Disability Correlation Chart
The statistical analysis conducted on geographies consisting of 174,100,032 people shows a slight positive correlation between the proportion of Immigrants from Syria and percentage of population with self-care disability in the United States with a correlation coefficient (R) of 0.063 and weighted average of 2.6%. Similarly, the statistical analysis conducted on geographies consisting of 571,452,222 people shows a significant positive correlation between the proportion of Hispanics or Latinos and percentage of population with self-care disability in the United States with a correlation coefficient (R) of 0.612 and weighted average of 2.7%, a difference of 3.4%.
Self-Care Disability Correlation Summary
| Measurement | Immigrants from Syria | Hispanic or Latino |
| Minimum | 0.40% | 2.2% |
| Maximum | 5.7% | 4.9% |
| Range | 5.3% | 2.8% |
| Mean | 2.7% | 2.8% |
| Median | 2.5% | 2.7% |
| Interquartile 25% (IQ1) | 2.2% | 2.5% |
| Interquartile 75% (IQ3) | 3.1% | 2.9% |
| Interquartile Range (IQR) | 0.86% | 0.42% |
| Standard Deviation (Sample) | 1.0% | 0.41% |
| Standard Deviation (Population) | 1.0% | 0.41% |
Similar Demographics by Self-Care Disability
Demographics Similar to Immigrants from Syria by Self-Care Disability
In terms of self-care disability, the demographic groups most similar to Immigrants from Syria are Marshallese (2.6%, a difference of 0.17%), Immigrants from Panama (2.6%, a difference of 0.20%), Spanish (2.6%, a difference of 0.23%), Senegalese (2.6%, a difference of 0.24%), and Hawaiian (2.6%, a difference of 0.31%).
| Demographics | Rating | Rank | Self-Care Disability |
| Vietnamese | 2.1 /100 | #234 | Tragic 2.6% |
| Bahamians | 2.0 /100 | #235 | Tragic 2.6% |
| Bermudans | 1.9 /100 | #236 | Tragic 2.6% |
| Immigrants | Senegal | 1.6 /100 | #237 | Tragic 2.6% |
| Senegalese | 1.3 /100 | #238 | Tragic 2.6% |
| Immigrants | Panama | 1.2 /100 | #239 | Tragic 2.6% |
| Marshallese | 1.2 /100 | #240 | Tragic 2.6% |
| Immigrants | Syria | 1.0 /100 | #241 | Tragic 2.6% |
| Spanish | 0.8 /100 | #242 | Tragic 2.6% |
| Hawaiians | 0.8 /100 | #243 | Tragic 2.6% |
| Yuman | 0.8 /100 | #244 | Tragic 2.6% |
| Immigrants | Western Asia | 0.6 /100 | #245 | Tragic 2.6% |
| Cheyenne | 0.6 /100 | #246 | Tragic 2.6% |
| Immigrants | Albania | 0.6 /100 | #247 | Tragic 2.6% |
| Nicaraguans | 0.6 /100 | #248 | Tragic 2.6% |
Demographics Similar to Hispanics or Latinos by Self-Care Disability
In terms of self-care disability, the demographic groups most similar to Hispanics or Latinos are Iroquois (2.7%, a difference of 0.020%), Ottawa (2.7%, a difference of 0.12%), Immigrants from Iraq (2.7%, a difference of 0.16%), Apache (2.7%, a difference of 0.17%), and Immigrants from Ukraine (2.7%, a difference of 0.20%).
| Demographics | Rating | Rank | Self-Care Disability |
| Mexicans | 0.1 /100 | #273 | Tragic 2.7% |
| Yakama | 0.1 /100 | #274 | Tragic 2.7% |
| Immigrants | Trinidad and Tobago | 0.1 /100 | #275 | Tragic 2.7% |
| Japanese | 0.1 /100 | #276 | Tragic 2.7% |
| Immigrants | Ukraine | 0.1 /100 | #277 | Tragic 2.7% |
| Ottawa | 0.1 /100 | #278 | Tragic 2.7% |
| Iroquois | 0.1 /100 | #279 | Tragic 2.7% |
| Hispanics or Latinos | 0.1 /100 | #280 | Tragic 2.7% |
| Immigrants | Iraq | 0.0 /100 | #281 | Tragic 2.7% |
| Apache | 0.0 /100 | #282 | Tragic 2.7% |
| Delaware | 0.0 /100 | #283 | Tragic 2.7% |
| Fijians | 0.0 /100 | #284 | Tragic 2.7% |
| Jamaicans | 0.0 /100 | #285 | Tragic 2.7% |
| French American Indians | 0.0 /100 | #286 | Tragic 2.7% |
| Immigrants | Jamaica | 0.0 /100 | #287 | Tragic 2.7% |