Tsimshian vs Hispanic or Latino Doctorate Degree
COMPARE
Tsimshian
Hispanic or Latino
Doctorate Degree
Doctorate Degree Comparison
Tsimshian
Hispanics or Latinos
1.4%
DOCTORATE DEGREE
0.2/ 100
METRIC RATING
297th/ 347
METRIC RANK
1.3%
DOCTORATE DEGREE
0.0/ 100
METRIC RATING
327th/ 347
METRIC RANK
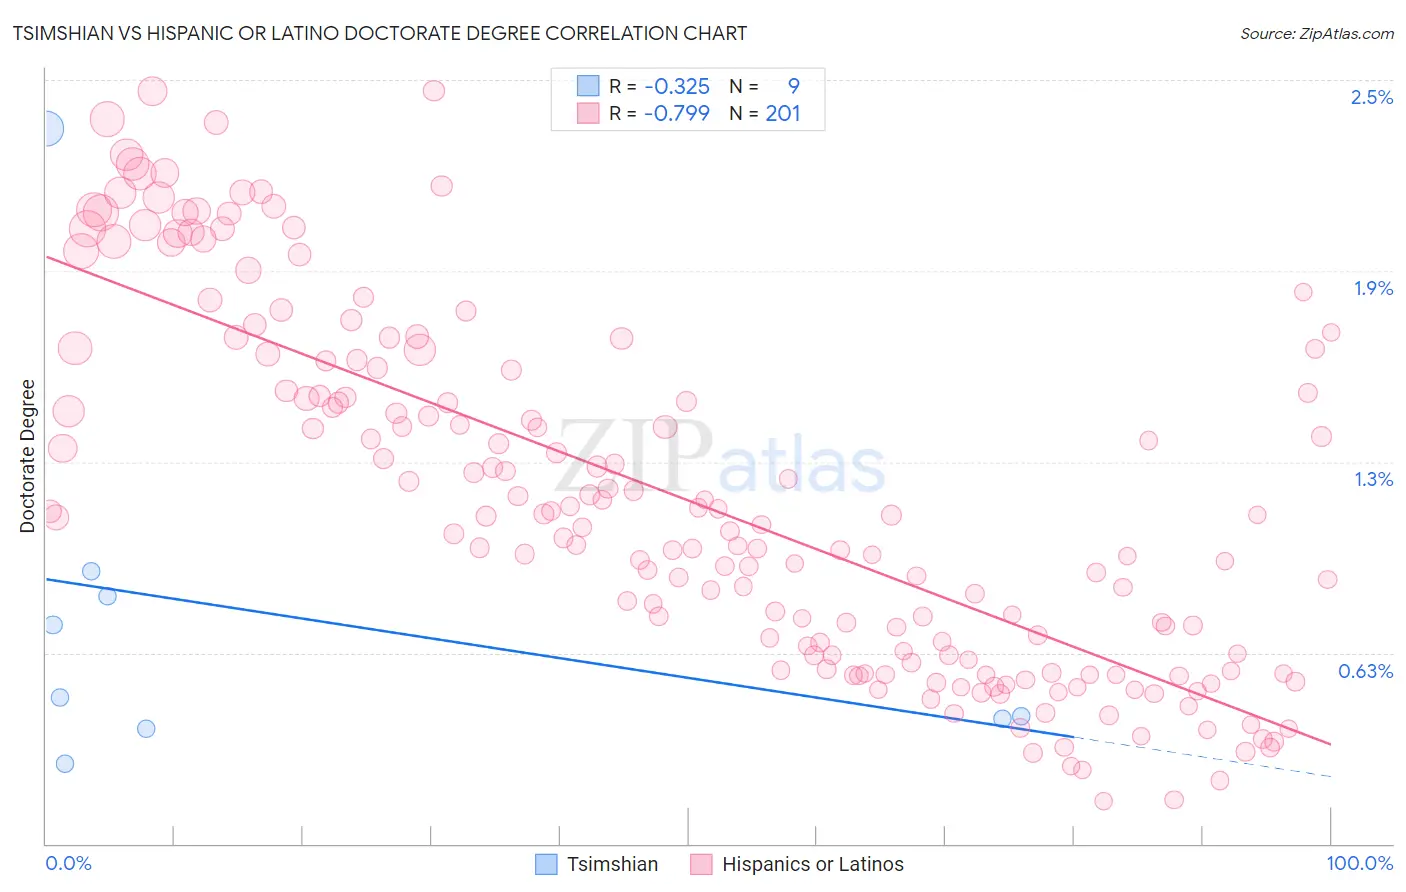
Tsimshian vs Hispanic or Latino Doctorate Degree Correlation Chart
The statistical analysis conducted on geographies consisting of 15,584,822 people shows a mild negative correlation between the proportion of Tsimshian and percentage of population with at least doctorate degree education in the United States with a correlation coefficient (R) of -0.325 and weighted average of 1.4%. Similarly, the statistical analysis conducted on geographies consisting of 551,277,814 people shows a strong negative correlation between the proportion of Hispanics or Latinos and percentage of population with at least doctorate degree education in the United States with a correlation coefficient (R) of -0.799 and weighted average of 1.3%, a difference of 6.9%.
Doctorate Degree Correlation Summary
| Measurement | Tsimshian | Hispanic or Latino |
| Minimum | 0.26% | 0.14% |
| Maximum | 2.3% | 2.5% |
| Range | 2.1% | 2.3% |
| Mean | 0.74% | 1.1% |
| Median | 0.48% | 1.0% |
| Interquartile 25% (IQ1) | 0.39% | 0.60% |
| Interquartile 75% (IQ3) | 0.85% | 1.6% |
| Interquartile Range (IQR) | 0.46% | 0.96% |
| Standard Deviation (Sample) | 0.64% | 0.58% |
| Standard Deviation (Population) | 0.60% | 0.58% |
Similar Demographics by Doctorate Degree
Demographics Similar to Tsimshian by Doctorate Degree
In terms of doctorate degree, the demographic groups most similar to Tsimshian are Immigrants from Ecuador (1.4%, a difference of 0.22%), Puerto Rican (1.4%, a difference of 0.41%), Guatemalan (1.4%, a difference of 0.45%), Belizean (1.4%, a difference of 0.85%), and Samoan (1.4%, a difference of 1.1%).
| Demographics | Rating | Rank | Doctorate Degree |
| Choctaw | 0.3 /100 | #290 | Tragic 1.4% |
| Blacks/African Americans | 0.3 /100 | #291 | Tragic 1.4% |
| Alaska Natives | 0.3 /100 | #292 | Tragic 1.4% |
| Immigrants | Yemen | 0.2 /100 | #293 | Tragic 1.4% |
| Samoans | 0.2 /100 | #294 | Tragic 1.4% |
| Guatemalans | 0.2 /100 | #295 | Tragic 1.4% |
| Immigrants | Ecuador | 0.2 /100 | #296 | Tragic 1.4% |
| Tsimshian | 0.2 /100 | #297 | Tragic 1.4% |
| Puerto Ricans | 0.1 /100 | #298 | Tragic 1.4% |
| Belizeans | 0.1 /100 | #299 | Tragic 1.4% |
| Immigrants | Guatemala | 0.1 /100 | #300 | Tragic 1.4% |
| Hondurans | 0.1 /100 | #301 | Tragic 1.4% |
| Shoshone | 0.1 /100 | #302 | Tragic 1.4% |
| Immigrants | Dominica | 0.1 /100 | #303 | Tragic 1.4% |
| Mexican American Indians | 0.1 /100 | #304 | Tragic 1.4% |
Demographics Similar to Hispanics or Latinos by Doctorate Degree
In terms of doctorate degree, the demographic groups most similar to Hispanics or Latinos are Immigrants from Cabo Verde (1.3%, a difference of 0.29%), Pima (1.3%, a difference of 0.31%), Inupiat (1.3%, a difference of 0.58%), Haitian (1.3%, a difference of 0.63%), and Native/Alaskan (1.3%, a difference of 0.70%).
| Demographics | Rating | Rank | Doctorate Degree |
| Immigrants | St. Vincent and the Grenadines | 0.1 /100 | #320 | Tragic 1.3% |
| Dutch West Indians | 0.1 /100 | #321 | Tragic 1.3% |
| Seminole | 0.1 /100 | #322 | Tragic 1.3% |
| Immigrants | Belize | 0.1 /100 | #323 | Tragic 1.3% |
| Natives/Alaskans | 0.0 /100 | #324 | Tragic 1.3% |
| Pima | 0.0 /100 | #325 | Tragic 1.3% |
| Immigrants | Cabo Verde | 0.0 /100 | #326 | Tragic 1.3% |
| Hispanics or Latinos | 0.0 /100 | #327 | Tragic 1.3% |
| Inupiat | 0.0 /100 | #328 | Tragic 1.3% |
| Haitians | 0.0 /100 | #329 | Tragic 1.3% |
| Yup'ik | 0.0 /100 | #330 | Tragic 1.3% |
| Immigrants | Latin America | 0.0 /100 | #331 | Tragic 1.3% |
| Yakama | 0.0 /100 | #332 | Tragic 1.3% |
| Immigrants | Caribbean | 0.0 /100 | #333 | Tragic 1.3% |
| Immigrants | Dominican Republic | 0.0 /100 | #334 | Tragic 1.3% |