Immigrants from Iran vs Hispanic or Latino Self-Care Disability
COMPARE
Immigrants from Iran
Hispanic or Latino
Self-Care Disability
Self-Care Disability Comparison
Immigrants from Iran
Hispanics or Latinos
2.7%
SELF-CARE DISABILITY
0.2/ 100
METRIC RATING
264th/ 347
METRIC RANK
2.7%
SELF-CARE DISABILITY
0.1/ 100
METRIC RATING
280th/ 347
METRIC RANK
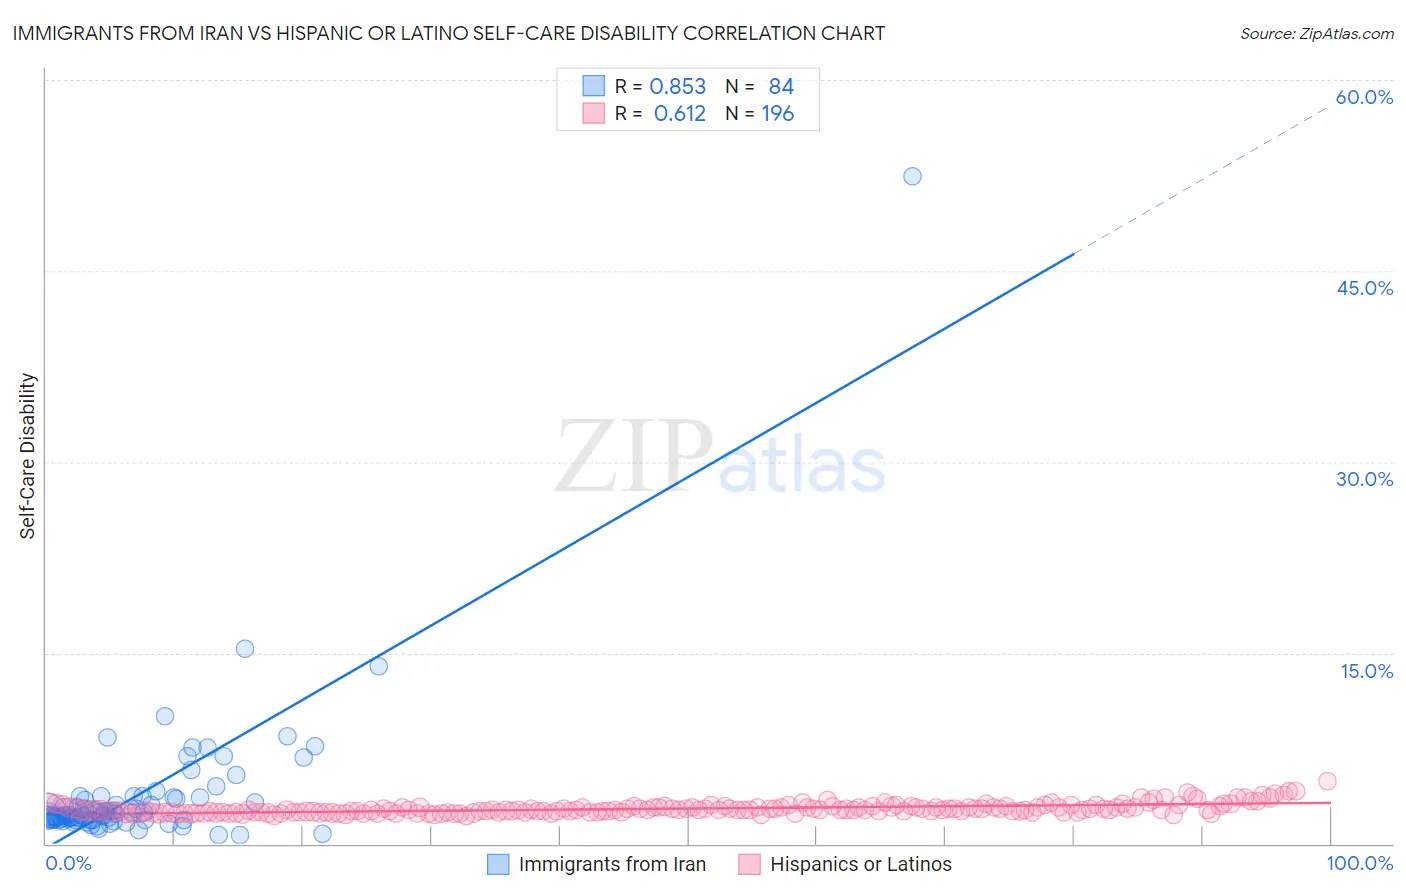
Immigrants from Iran vs Hispanic or Latino Self-Care Disability Correlation Chart
The statistical analysis conducted on geographies consisting of 279,736,483 people shows a very strong positive correlation between the proportion of Immigrants from Iran and percentage of population with self-care disability in the United States with a correlation coefficient (R) of 0.853 and weighted average of 2.7%. Similarly, the statistical analysis conducted on geographies consisting of 571,452,222 people shows a significant positive correlation between the proportion of Hispanics or Latinos and percentage of population with self-care disability in the United States with a correlation coefficient (R) of 0.612 and weighted average of 2.7%, a difference of 1.4%.
Self-Care Disability Correlation Summary
| Measurement | Immigrants from Iran | Hispanic or Latino |
| Minimum | 0.72% | 2.2% |
| Maximum | 52.5% | 4.9% |
| Range | 51.8% | 2.8% |
| Mean | 3.9% | 2.8% |
| Median | 2.3% | 2.7% |
| Interquartile 25% (IQ1) | 1.9% | 2.5% |
| Interquartile 75% (IQ3) | 3.6% | 2.9% |
| Interquartile Range (IQR) | 1.7% | 0.42% |
| Standard Deviation (Sample) | 6.0% | 0.41% |
| Standard Deviation (Population) | 5.9% | 0.41% |
Demographics Similar to Immigrants from Iran and Hispanics or Latinos by Self-Care Disability
In terms of self-care disability, the demographic groups most similar to Immigrants from Iran are Immigrants from Latin America (2.7%, a difference of 0.060%), Shoshone (2.7%, a difference of 0.13%), Immigrants from Nicaragua (2.7%, a difference of 0.16%), Immigrants from Cambodia (2.7%, a difference of 0.21%), and Yaqui (2.7%, a difference of 0.41%). Similarly, the demographic groups most similar to Hispanics or Latinos are Iroquois (2.7%, a difference of 0.020%), Ottawa (2.7%, a difference of 0.12%), Immigrants from Iraq (2.7%, a difference of 0.16%), Apache (2.7%, a difference of 0.17%), and Immigrants from Ukraine (2.7%, a difference of 0.20%).
| Demographics | Rating | Rank | Self-Care Disability |
| Shoshone | 0.2 /100 | #262 | Tragic 2.7% |
| Immigrants | Latin America | 0.2 /100 | #263 | Tragic 2.7% |
| Immigrants | Iran | 0.2 /100 | #264 | Tragic 2.7% |
| Immigrants | Nicaragua | 0.2 /100 | #265 | Tragic 2.7% |
| Immigrants | Cambodia | 0.1 /100 | #266 | Tragic 2.7% |
| Yaqui | 0.1 /100 | #267 | Tragic 2.7% |
| Immigrants | Mexico | 0.1 /100 | #268 | Tragic 2.7% |
| U.S. Virgin Islanders | 0.1 /100 | #269 | Tragic 2.7% |
| Immigrants | Micronesia | 0.1 /100 | #270 | Tragic 2.7% |
| Trinidadians and Tobagonians | 0.1 /100 | #271 | Tragic 2.7% |
| Immigrants | Laos | 0.1 /100 | #272 | Tragic 2.7% |
| Mexicans | 0.1 /100 | #273 | Tragic 2.7% |
| Yakama | 0.1 /100 | #274 | Tragic 2.7% |
| Immigrants | Trinidad and Tobago | 0.1 /100 | #275 | Tragic 2.7% |
| Japanese | 0.1 /100 | #276 | Tragic 2.7% |
| Immigrants | Ukraine | 0.1 /100 | #277 | Tragic 2.7% |
| Ottawa | 0.1 /100 | #278 | Tragic 2.7% |
| Iroquois | 0.1 /100 | #279 | Tragic 2.7% |
| Hispanics or Latinos | 0.1 /100 | #280 | Tragic 2.7% |
| Immigrants | Iraq | 0.0 /100 | #281 | Tragic 2.7% |
| Apache | 0.0 /100 | #282 | Tragic 2.7% |