Tsimshian vs Fijian Doctorate Degree
COMPARE
Tsimshian
Fijian
Doctorate Degree
Doctorate Degree Comparison
Tsimshian
Fijians
1.4%
DOCTORATE DEGREE
0.2/ 100
METRIC RATING
297th/ 347
METRIC RANK
1.1%
DOCTORATE DEGREE
0.0/ 100
METRIC RATING
343rd/ 347
METRIC RANK
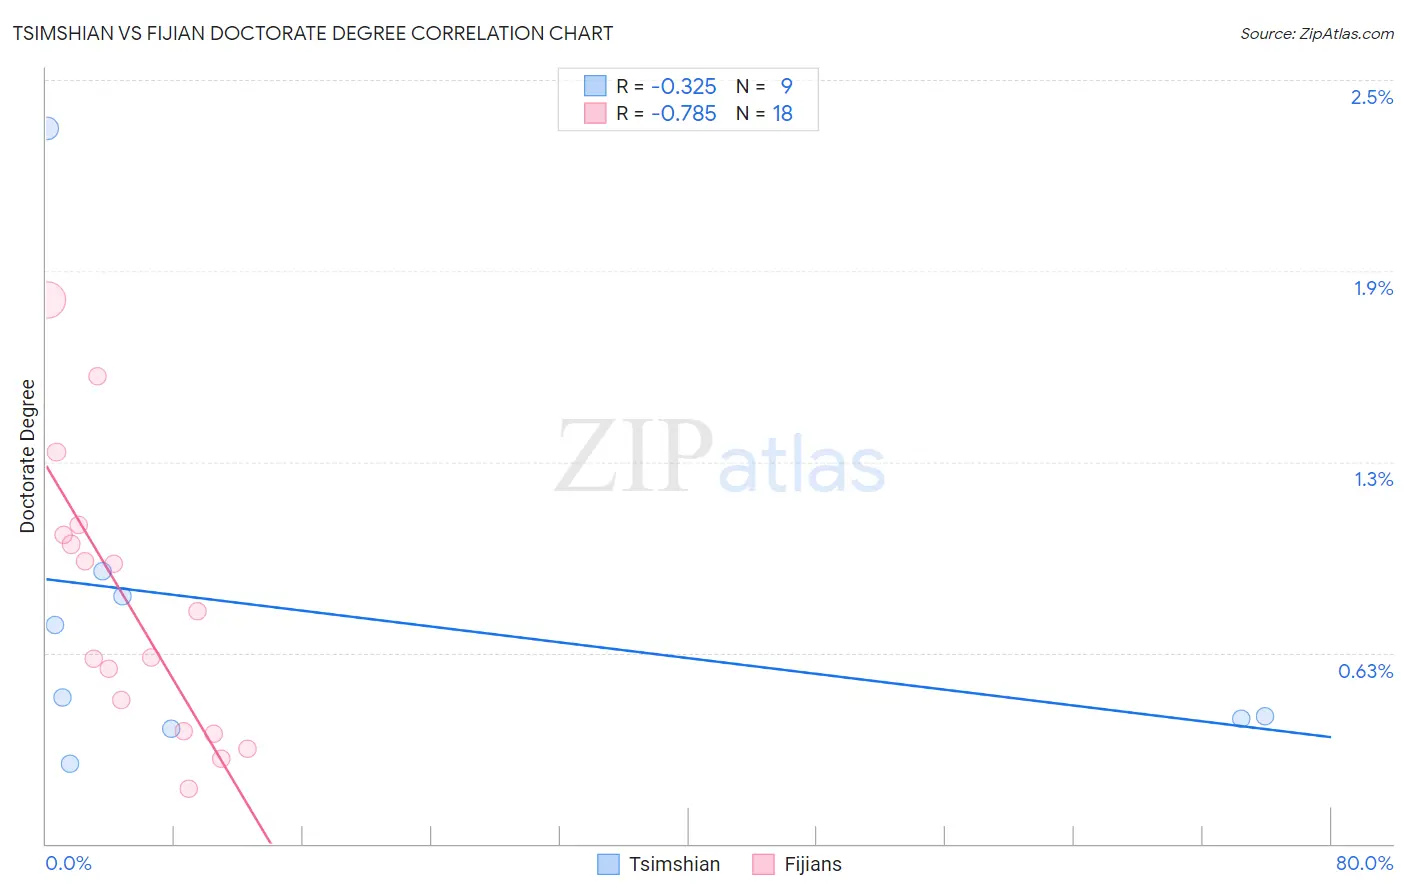
Tsimshian vs Fijian Doctorate Degree Correlation Chart
The statistical analysis conducted on geographies consisting of 15,584,822 people shows a mild negative correlation between the proportion of Tsimshian and percentage of population with at least doctorate degree education in the United States with a correlation coefficient (R) of -0.325 and weighted average of 1.4%. Similarly, the statistical analysis conducted on geographies consisting of 55,685,158 people shows a strong negative correlation between the proportion of Fijians and percentage of population with at least doctorate degree education in the United States with a correlation coefficient (R) of -0.785 and weighted average of 1.1%, a difference of 24.5%.
Doctorate Degree Correlation Summary
| Measurement | Tsimshian | Fijian |
| Minimum | 0.26% | 0.18% |
| Maximum | 2.3% | 1.8% |
| Range | 2.1% | 1.6% |
| Mean | 0.74% | 0.78% |
| Median | 0.48% | 0.68% |
| Interquartile 25% (IQ1) | 0.39% | 0.37% |
| Interquartile 75% (IQ3) | 0.85% | 1.0% |
| Interquartile Range (IQR) | 0.46% | 0.64% |
| Standard Deviation (Sample) | 0.64% | 0.45% |
| Standard Deviation (Population) | 0.60% | 0.43% |
Similar Demographics by Doctorate Degree
Demographics Similar to Tsimshian by Doctorate Degree
In terms of doctorate degree, the demographic groups most similar to Tsimshian are Immigrants from Ecuador (1.4%, a difference of 0.22%), Puerto Rican (1.4%, a difference of 0.41%), Guatemalan (1.4%, a difference of 0.45%), Belizean (1.4%, a difference of 0.85%), and Samoan (1.4%, a difference of 1.1%).
| Demographics | Rating | Rank | Doctorate Degree |
| Choctaw | 0.3 /100 | #290 | Tragic 1.4% |
| Blacks/African Americans | 0.3 /100 | #291 | Tragic 1.4% |
| Alaska Natives | 0.3 /100 | #292 | Tragic 1.4% |
| Immigrants | Yemen | 0.2 /100 | #293 | Tragic 1.4% |
| Samoans | 0.2 /100 | #294 | Tragic 1.4% |
| Guatemalans | 0.2 /100 | #295 | Tragic 1.4% |
| Immigrants | Ecuador | 0.2 /100 | #296 | Tragic 1.4% |
| Tsimshian | 0.2 /100 | #297 | Tragic 1.4% |
| Puerto Ricans | 0.1 /100 | #298 | Tragic 1.4% |
| Belizeans | 0.1 /100 | #299 | Tragic 1.4% |
| Immigrants | Guatemala | 0.1 /100 | #300 | Tragic 1.4% |
| Hondurans | 0.1 /100 | #301 | Tragic 1.4% |
| Shoshone | 0.1 /100 | #302 | Tragic 1.4% |
| Immigrants | Dominica | 0.1 /100 | #303 | Tragic 1.4% |
| Mexican American Indians | 0.1 /100 | #304 | Tragic 1.4% |
Demographics Similar to Fijians by Doctorate Degree
In terms of doctorate degree, the demographic groups most similar to Fijians are Immigrants from Mexico (1.1%, a difference of 2.1%), Arapaho (1.2%, a difference of 3.4%), Lumbee (1.1%, a difference of 3.6%), Mexican (1.2%, a difference of 3.8%), and Immigrants from Cuba (1.2%, a difference of 4.3%).
| Demographics | Rating | Rank | Doctorate Degree |
| Immigrants | Caribbean | 0.0 /100 | #333 | Tragic 1.3% |
| Immigrants | Dominican Republic | 0.0 /100 | #334 | Tragic 1.3% |
| Immigrants | Haiti | 0.0 /100 | #335 | Tragic 1.3% |
| Nepalese | 0.0 /100 | #336 | Tragic 1.3% |
| Bangladeshis | 0.0 /100 | #337 | Tragic 1.2% |
| Puget Sound Salish | 0.0 /100 | #338 | Tragic 1.2% |
| Immigrants | Central America | 0.0 /100 | #339 | Tragic 1.2% |
| Immigrants | Cuba | 0.0 /100 | #340 | Tragic 1.2% |
| Mexicans | 0.0 /100 | #341 | Tragic 1.2% |
| Arapaho | 0.0 /100 | #342 | Tragic 1.2% |
| Fijians | 0.0 /100 | #343 | Tragic 1.1% |
| Immigrants | Mexico | 0.0 /100 | #344 | Tragic 1.1% |
| Lumbee | 0.0 /100 | #345 | Tragic 1.1% |
| Spanish American Indians | 0.0 /100 | #346 | Tragic 1.1% |
| Houma | 0.0 /100 | #347 | Tragic 0.96% |