Tsimshian vs Immigrants from Zimbabwe Male Disability
COMPARE
Tsimshian
Immigrants from Zimbabwe
Male Disability
Male Disability Comparison
Tsimshian
Immigrants from Zimbabwe
15.6%
MALE DISABILITY
0.0/ 100
METRIC RATING
345th/ 347
METRIC RANK
10.8%
MALE DISABILITY
93.0/ 100
METRIC RATING
113th/ 347
METRIC RANK
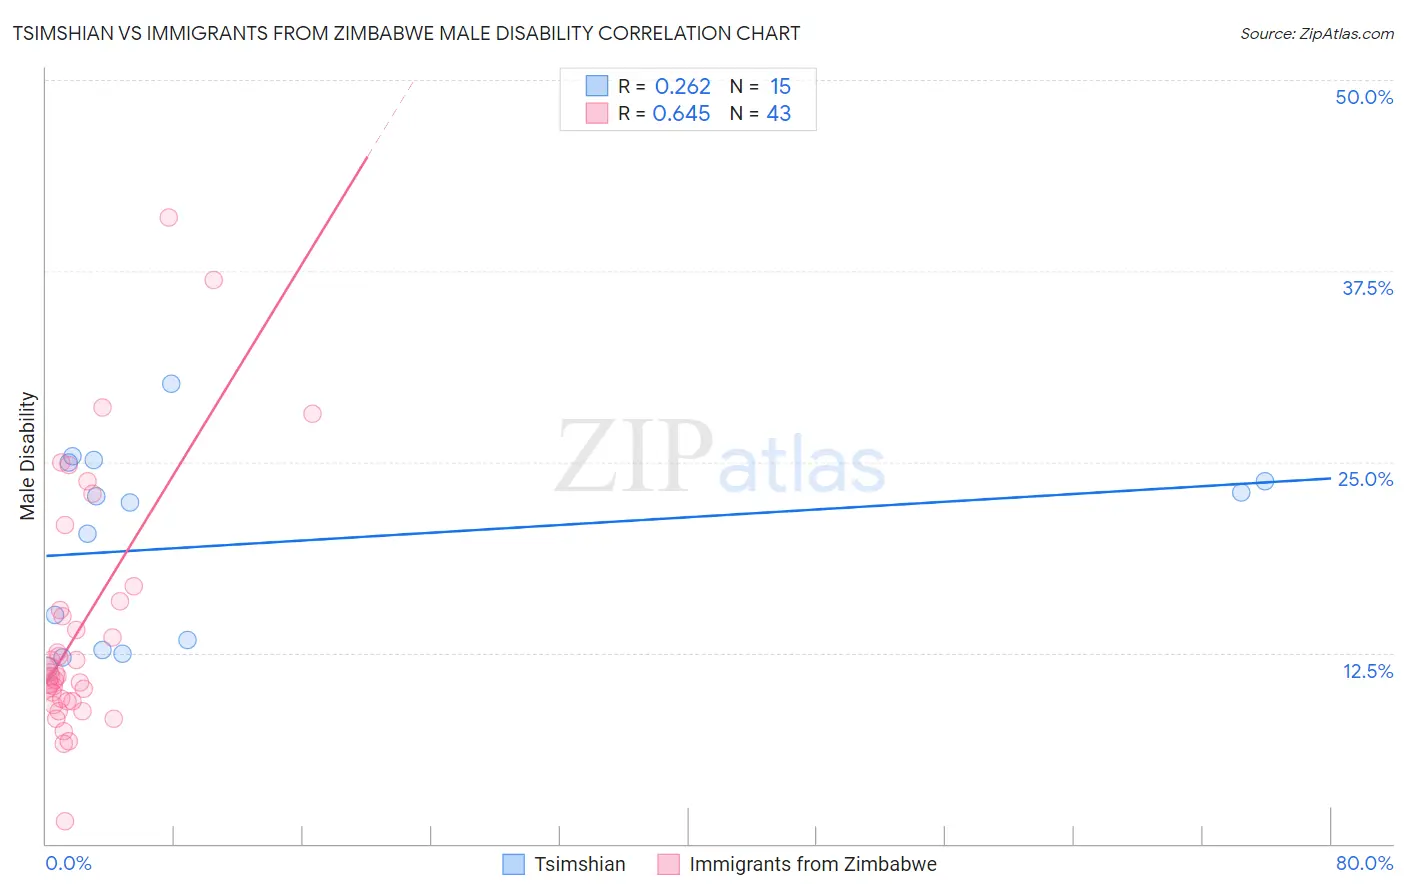
Tsimshian vs Immigrants from Zimbabwe Male Disability Correlation Chart
The statistical analysis conducted on geographies consisting of 15,626,544 people shows a weak positive correlation between the proportion of Tsimshian and percentage of males with a disability in the United States with a correlation coefficient (R) of 0.262 and weighted average of 15.6%. Similarly, the statistical analysis conducted on geographies consisting of 117,811,453 people shows a significant positive correlation between the proportion of Immigrants from Zimbabwe and percentage of males with a disability in the United States with a correlation coefficient (R) of 0.645 and weighted average of 10.8%, a difference of 44.3%.
Male Disability Correlation Summary
| Measurement | Tsimshian | Immigrants from Zimbabwe |
| Minimum | 11.5% | 1.5% |
| Maximum | 30.2% | 41.0% |
| Range | 18.6% | 39.5% |
| Mean | 19.7% | 14.2% |
| Median | 22.4% | 11.0% |
| Interquartile 25% (IQ1) | 12.7% | 9.4% |
| Interquartile 75% (IQ3) | 25.0% | 15.9% |
| Interquartile Range (IQR) | 12.3% | 6.5% |
| Standard Deviation (Sample) | 6.1% | 8.2% |
| Standard Deviation (Population) | 5.9% | 8.1% |
Similar Demographics by Male Disability
Demographics Similar to Tsimshian by Male Disability
In terms of male disability, the demographic groups most similar to Tsimshian are Puerto Rican (15.6%, a difference of 0.32%), Creek (15.5%, a difference of 0.45%), Kiowa (15.4%, a difference of 1.1%), Choctaw (15.4%, a difference of 1.3%), and Lumbee (15.2%, a difference of 2.4%).
| Demographics | Rating | Rank | Male Disability |
| Yuman | 0.0 /100 | #333 | Tragic 14.7% |
| Cherokee | 0.0 /100 | #334 | Tragic 14.8% |
| Dutch West Indians | 0.0 /100 | #335 | Tragic 14.8% |
| Alaskan Athabascans | 0.0 /100 | #336 | Tragic 14.9% |
| Menominee | 0.0 /100 | #337 | Tragic 15.0% |
| Pueblo | 0.0 /100 | #338 | Tragic 15.0% |
| Chickasaw | 0.0 /100 | #339 | Tragic 15.1% |
| Lumbee | 0.0 /100 | #340 | Tragic 15.2% |
| Choctaw | 0.0 /100 | #341 | Tragic 15.4% |
| Kiowa | 0.0 /100 | #342 | Tragic 15.4% |
| Creek | 0.0 /100 | #343 | Tragic 15.5% |
| Puerto Ricans | 0.0 /100 | #344 | Tragic 15.6% |
| Tsimshian | 0.0 /100 | #345 | Tragic 15.6% |
| Colville | 0.0 /100 | #346 | Tragic 16.5% |
| Houma | 0.0 /100 | #347 | Tragic 17.4% |
Demographics Similar to Immigrants from Zimbabwe by Male Disability
In terms of male disability, the demographic groups most similar to Immigrants from Zimbabwe are Central American (10.8%, a difference of 0.070%), Ghanaian (10.8%, a difference of 0.090%), Immigrants from Barbados (10.8%, a difference of 0.16%), Immigrants from Uruguay (10.8%, a difference of 0.18%), and Immigrants (10.8%, a difference of 0.22%).
| Demographics | Rating | Rank | Male Disability |
| Immigrants | Syria | 94.9 /100 | #106 | Exceptional 10.8% |
| Immigrants | Eastern Africa | 94.3 /100 | #107 | Exceptional 10.8% |
| Immigrants | Belgium | 94.2 /100 | #108 | Exceptional 10.8% |
| Immigrants | Uganda | 94.0 /100 | #109 | Exceptional 10.8% |
| Immigrants | Immigrants | 93.9 /100 | #110 | Exceptional 10.8% |
| Immigrants | Uruguay | 93.8 /100 | #111 | Exceptional 10.8% |
| Ghanaians | 93.4 /100 | #112 | Exceptional 10.8% |
| Immigrants | Zimbabwe | 93.0 /100 | #113 | Exceptional 10.8% |
| Central Americans | 92.7 /100 | #114 | Exceptional 10.8% |
| Immigrants | Barbados | 92.2 /100 | #115 | Exceptional 10.8% |
| Immigrants | South Africa | 91.8 /100 | #116 | Exceptional 10.8% |
| Eastern Europeans | 90.6 /100 | #117 | Exceptional 10.9% |
| Immigrants | Cuba | 90.2 /100 | #118 | Exceptional 10.9% |
| Armenians | 90.1 /100 | #119 | Exceptional 10.9% |
| Immigrants | Africa | 89.4 /100 | #120 | Excellent 10.9% |