Tsimshian vs Immigrants from Belarus Male Disability
COMPARE
Tsimshian
Immigrants from Belarus
Male Disability
Male Disability Comparison
Tsimshian
Immigrants from Belarus
15.6%
MALE DISABILITY
0.0/ 100
METRIC RATING
345th/ 347
METRIC RANK
10.4%
MALE DISABILITY
99.3/ 100
METRIC RATING
63rd/ 347
METRIC RANK
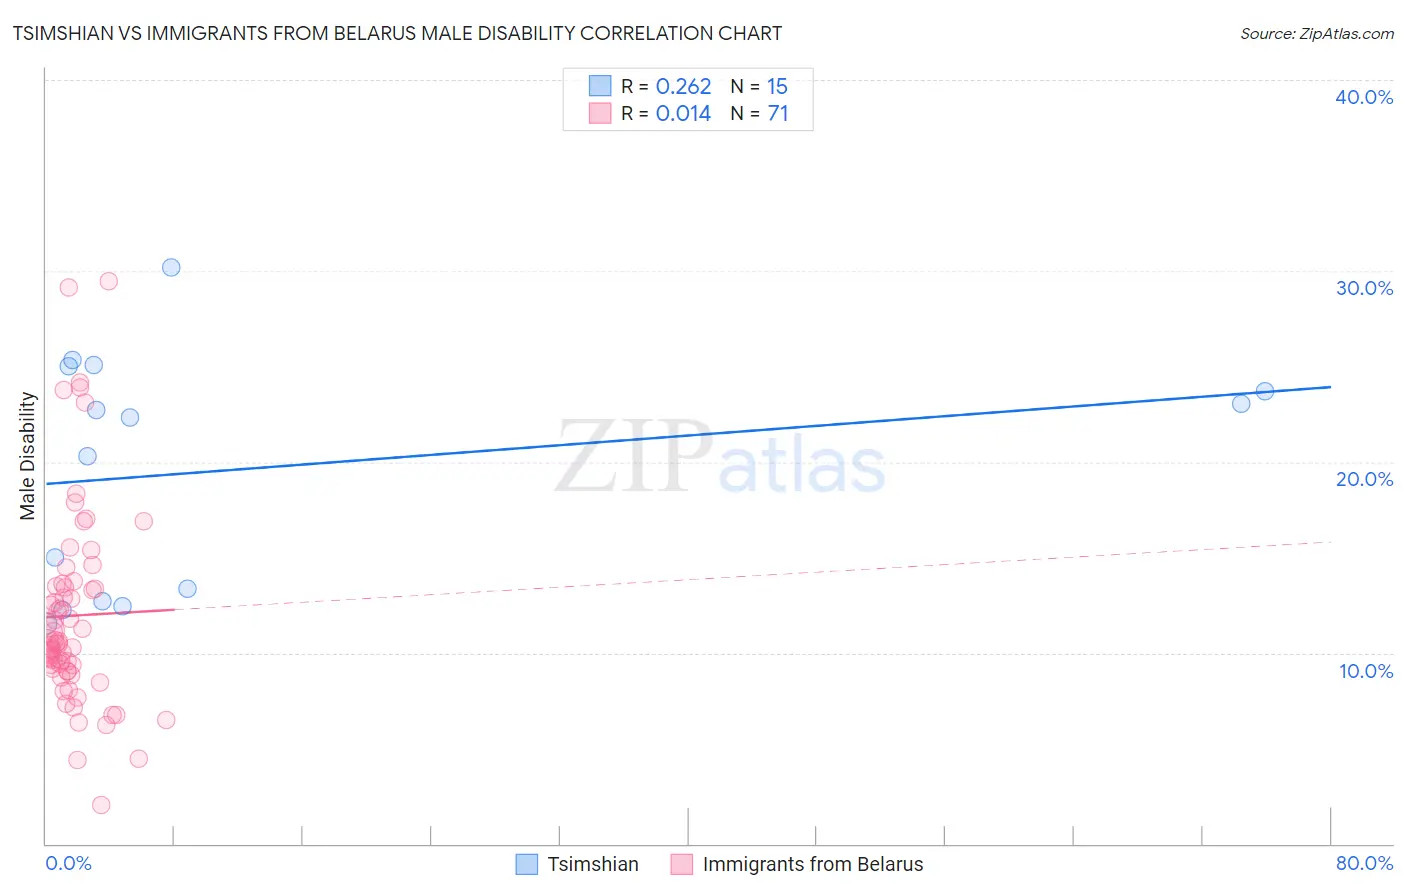
Tsimshian vs Immigrants from Belarus Male Disability Correlation Chart
The statistical analysis conducted on geographies consisting of 15,626,544 people shows a weak positive correlation between the proportion of Tsimshian and percentage of males with a disability in the United States with a correlation coefficient (R) of 0.262 and weighted average of 15.6%. Similarly, the statistical analysis conducted on geographies consisting of 150,193,333 people shows no correlation between the proportion of Immigrants from Belarus and percentage of males with a disability in the United States with a correlation coefficient (R) of 0.014 and weighted average of 10.4%, a difference of 49.4%.
Male Disability Correlation Summary
| Measurement | Tsimshian | Immigrants from Belarus |
| Minimum | 11.5% | 2.0% |
| Maximum | 30.2% | 29.5% |
| Range | 18.6% | 27.4% |
| Mean | 19.7% | 11.9% |
| Median | 22.4% | 10.5% |
| Interquartile 25% (IQ1) | 12.7% | 9.0% |
| Interquartile 75% (IQ3) | 25.0% | 13.5% |
| Interquartile Range (IQR) | 12.3% | 4.4% |
| Standard Deviation (Sample) | 6.1% | 5.3% |
| Standard Deviation (Population) | 5.9% | 5.2% |
Similar Demographics by Male Disability
Demographics Similar to Tsimshian by Male Disability
In terms of male disability, the demographic groups most similar to Tsimshian are Puerto Rican (15.6%, a difference of 0.32%), Creek (15.5%, a difference of 0.45%), Kiowa (15.4%, a difference of 1.1%), Choctaw (15.4%, a difference of 1.3%), and Lumbee (15.2%, a difference of 2.4%).
| Demographics | Rating | Rank | Male Disability |
| Yuman | 0.0 /100 | #333 | Tragic 14.7% |
| Cherokee | 0.0 /100 | #334 | Tragic 14.8% |
| Dutch West Indians | 0.0 /100 | #335 | Tragic 14.8% |
| Alaskan Athabascans | 0.0 /100 | #336 | Tragic 14.9% |
| Menominee | 0.0 /100 | #337 | Tragic 15.0% |
| Pueblo | 0.0 /100 | #338 | Tragic 15.0% |
| Chickasaw | 0.0 /100 | #339 | Tragic 15.1% |
| Lumbee | 0.0 /100 | #340 | Tragic 15.2% |
| Choctaw | 0.0 /100 | #341 | Tragic 15.4% |
| Kiowa | 0.0 /100 | #342 | Tragic 15.4% |
| Creek | 0.0 /100 | #343 | Tragic 15.5% |
| Puerto Ricans | 0.0 /100 | #344 | Tragic 15.6% |
| Tsimshian | 0.0 /100 | #345 | Tragic 15.6% |
| Colville | 0.0 /100 | #346 | Tragic 16.5% |
| Houma | 0.0 /100 | #347 | Tragic 17.4% |
Demographics Similar to Immigrants from Belarus by Male Disability
In terms of male disability, the demographic groups most similar to Immigrants from Belarus are Immigrants from Ecuador (10.4%, a difference of 0.020%), Jordanian (10.5%, a difference of 0.12%), Immigrants from Grenada (10.5%, a difference of 0.15%), Guyanese (10.5%, a difference of 0.15%), and Immigrants from Afghanistan (10.5%, a difference of 0.16%).
| Demographics | Rating | Rank | Male Disability |
| Tongans | 99.6 /100 | #56 | Exceptional 10.4% |
| Immigrants | South America | 99.6 /100 | #57 | Exceptional 10.4% |
| Immigrants | Japan | 99.5 /100 | #58 | Exceptional 10.4% |
| Immigrants | Australia | 99.5 /100 | #59 | Exceptional 10.4% |
| Immigrants | Colombia | 99.5 /100 | #60 | Exceptional 10.4% |
| Immigrants | Northern Africa | 99.4 /100 | #61 | Exceptional 10.4% |
| Immigrants | Ecuador | 99.3 /100 | #62 | Exceptional 10.4% |
| Immigrants | Belarus | 99.3 /100 | #63 | Exceptional 10.4% |
| Jordanians | 99.3 /100 | #64 | Exceptional 10.5% |
| Immigrants | Grenada | 99.2 /100 | #65 | Exceptional 10.5% |
| Guyanese | 99.2 /100 | #66 | Exceptional 10.5% |
| Immigrants | Afghanistan | 99.2 /100 | #67 | Exceptional 10.5% |
| Colombians | 99.2 /100 | #68 | Exceptional 10.5% |
| Ecuadorians | 99.2 /100 | #69 | Exceptional 10.5% |
| Immigrants | Bulgaria | 99.1 /100 | #70 | Exceptional 10.5% |