Tsimshian vs Fijian Professional Degree
COMPARE
Tsimshian
Fijian
Professional Degree
Professional Degree Comparison
Tsimshian
Fijians
3.2%
PROFESSIONAL DEGREE
0.0/ 100
METRIC RATING
321st/ 347
METRIC RANK
2.9%
PROFESSIONAL DEGREE
0.0/ 100
METRIC RATING
336th/ 347
METRIC RANK
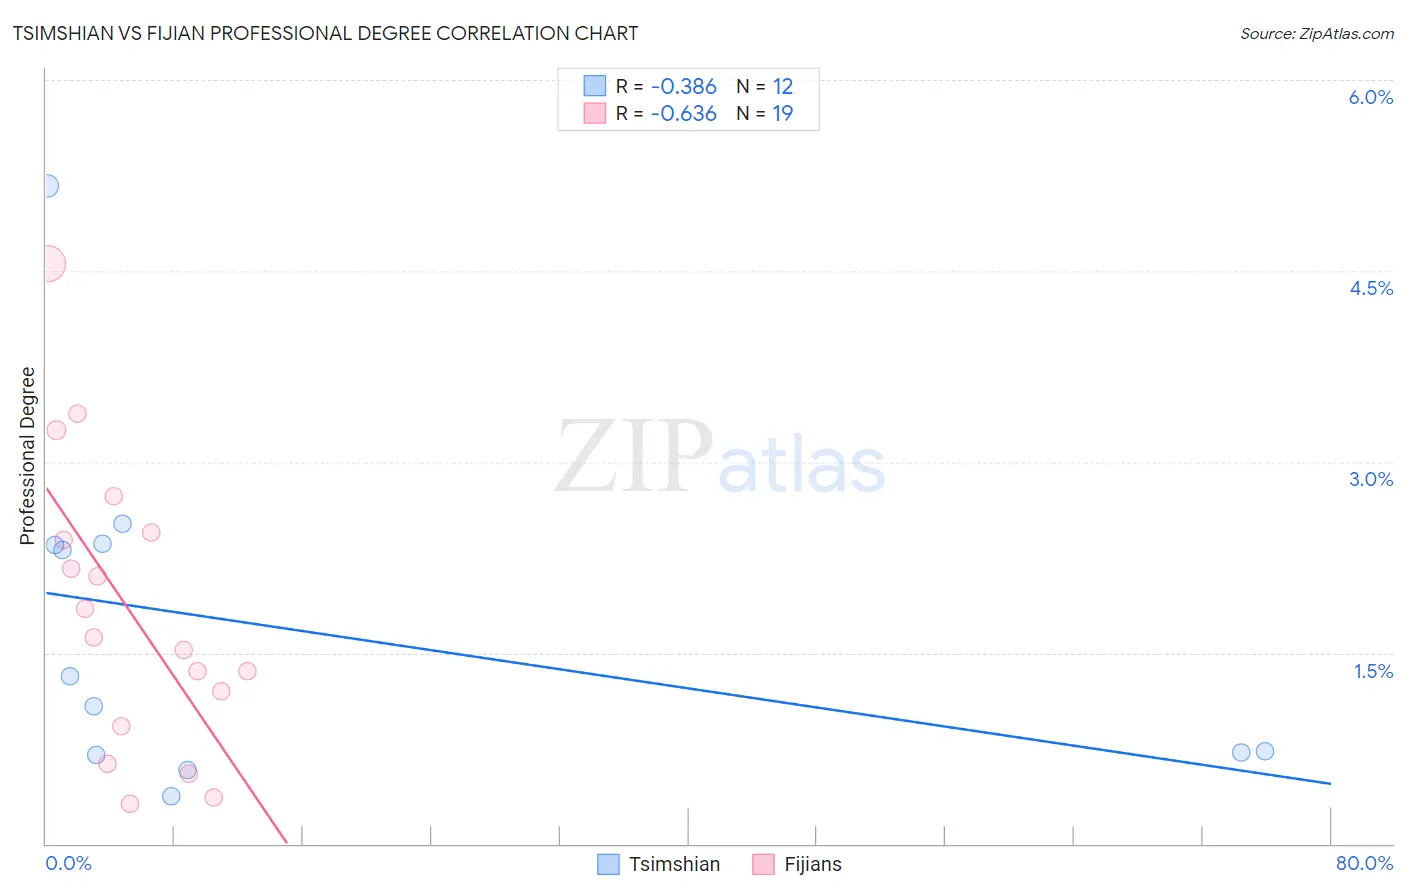
Tsimshian vs Fijian Professional Degree Correlation Chart
The statistical analysis conducted on geographies consisting of 15,614,727 people shows a mild negative correlation between the proportion of Tsimshian and percentage of population with at least professional degree education in the United States with a correlation coefficient (R) of -0.386 and weighted average of 3.2%. Similarly, the statistical analysis conducted on geographies consisting of 55,894,250 people shows a significant negative correlation between the proportion of Fijians and percentage of population with at least professional degree education in the United States with a correlation coefficient (R) of -0.636 and weighted average of 2.9%, a difference of 8.7%.
Professional Degree Correlation Summary
| Measurement | Tsimshian | Fijian |
| Minimum | 0.38% | 0.32% |
| Maximum | 5.2% | 4.6% |
| Range | 4.8% | 4.2% |
| Mean | 1.7% | 1.8% |
| Median | 1.2% | 1.6% |
| Interquartile 25% (IQ1) | 0.71% | 0.93% |
| Interquartile 75% (IQ3) | 2.4% | 2.4% |
| Interquartile Range (IQR) | 1.6% | 1.5% |
| Standard Deviation (Sample) | 1.4% | 1.1% |
| Standard Deviation (Population) | 1.3% | 1.1% |
Demographics Similar to Tsimshian and Fijians by Professional Degree
In terms of professional degree, the demographic groups most similar to Tsimshian are Seminole (3.2%, a difference of 0.36%), Hispanic or Latino (3.2%, a difference of 0.36%), Inupiat (3.2%, a difference of 0.44%), Crow (3.2%, a difference of 0.72%), and Yaqui (3.2%, a difference of 0.78%). Similarly, the demographic groups most similar to Fijians are Native/Alaskan (3.0%, a difference of 1.0%), Pennsylvania German (3.0%, a difference of 1.6%), Arapaho (2.9%, a difference of 1.8%), Navajo (2.9%, a difference of 1.9%), and Puget Sound Salish (3.1%, a difference of 5.2%).
| Demographics | Rating | Rank | Professional Degree |
| Immigrants | Micronesia | 0.1 /100 | #318 | Tragic 3.2% |
| Choctaw | 0.1 /100 | #319 | Tragic 3.2% |
| Seminole | 0.1 /100 | #320 | Tragic 3.2% |
| Tsimshian | 0.0 /100 | #321 | Tragic 3.2% |
| Hispanics or Latinos | 0.0 /100 | #322 | Tragic 3.2% |
| Inupiat | 0.0 /100 | #323 | Tragic 3.2% |
| Crow | 0.0 /100 | #324 | Tragic 3.2% |
| Yaqui | 0.0 /100 | #325 | Tragic 3.2% |
| Menominee | 0.0 /100 | #326 | Tragic 3.1% |
| Dutch West Indians | 0.0 /100 | #327 | Tragic 3.1% |
| Creek | 0.0 /100 | #328 | Tragic 3.1% |
| Bangladeshis | 0.0 /100 | #329 | Tragic 3.1% |
| Immigrants | Cabo Verde | 0.0 /100 | #330 | Tragic 3.1% |
| Kiowa | 0.0 /100 | #331 | Tragic 3.1% |
| Yakama | 0.0 /100 | #332 | Tragic 3.1% |
| Puget Sound Salish | 0.0 /100 | #333 | Tragic 3.1% |
| Pennsylvania Germans | 0.0 /100 | #334 | Tragic 3.0% |
| Natives/Alaskans | 0.0 /100 | #335 | Tragic 3.0% |
| Fijians | 0.0 /100 | #336 | Tragic 2.9% |
| Arapaho | 0.0 /100 | #337 | Tragic 2.9% |
| Navajo | 0.0 /100 | #338 | Tragic 2.9% |