Afghan vs Immigrants from Zimbabwe Male Disability
COMPARE
Afghan
Immigrants from Zimbabwe
Male Disability
Male Disability Comparison
Afghans
Immigrants from Zimbabwe
10.2%
MALE DISABILITY
99.8/ 100
METRIC RATING
39th/ 347
METRIC RANK
10.8%
MALE DISABILITY
93.0/ 100
METRIC RATING
113th/ 347
METRIC RANK
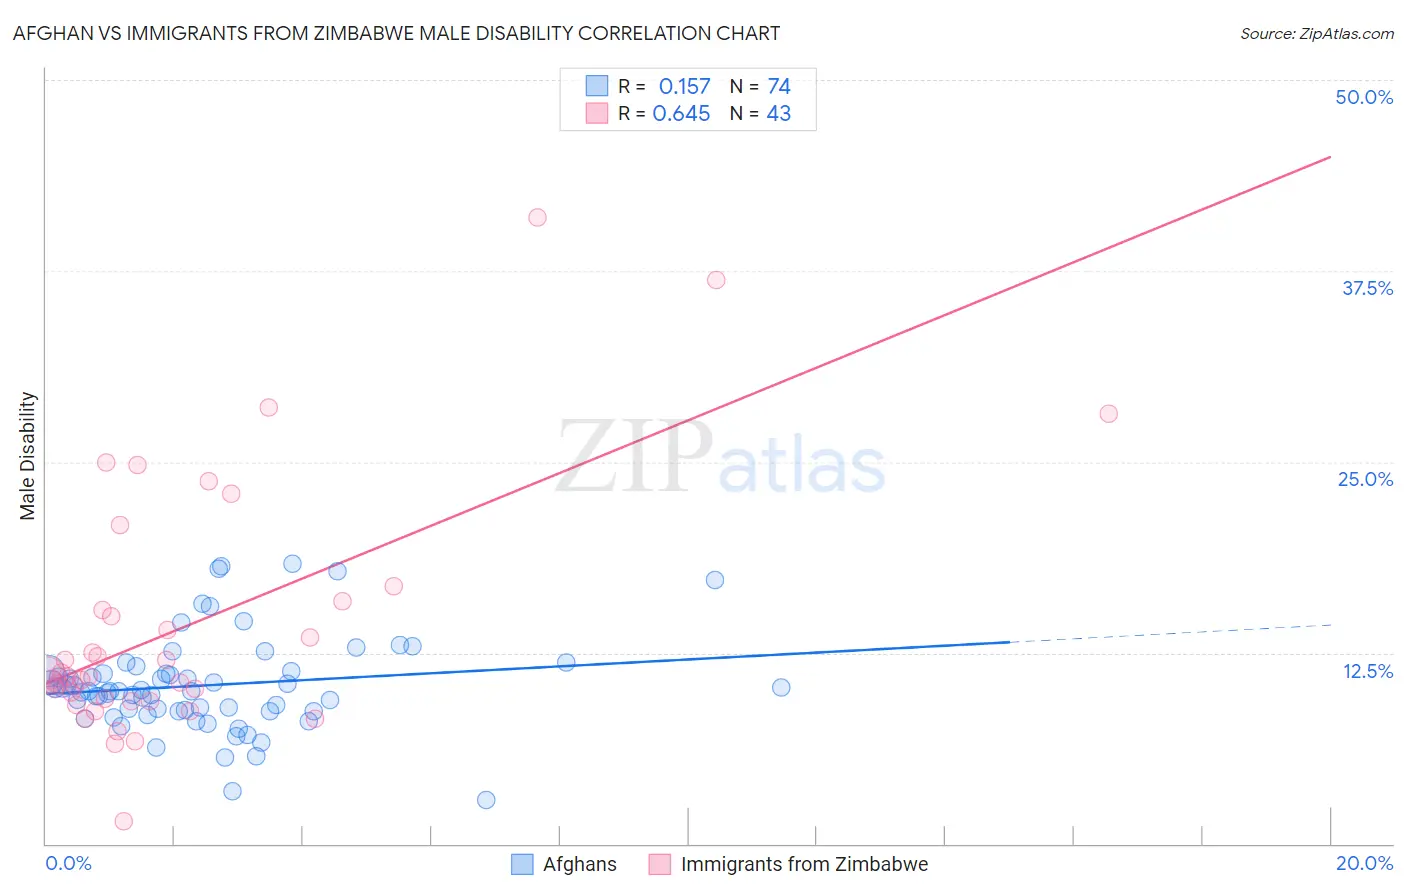
Afghan vs Immigrants from Zimbabwe Male Disability Correlation Chart
The statistical analysis conducted on geographies consisting of 148,871,579 people shows a poor positive correlation between the proportion of Afghans and percentage of males with a disability in the United States with a correlation coefficient (R) of 0.157 and weighted average of 10.2%. Similarly, the statistical analysis conducted on geographies consisting of 117,811,453 people shows a significant positive correlation between the proportion of Immigrants from Zimbabwe and percentage of males with a disability in the United States with a correlation coefficient (R) of 0.645 and weighted average of 10.8%, a difference of 5.5%.
Male Disability Correlation Summary
| Measurement | Afghan | Immigrants from Zimbabwe |
| Minimum | 2.9% | 1.5% |
| Maximum | 18.3% | 41.0% |
| Range | 15.4% | 39.5% |
| Mean | 10.4% | 14.2% |
| Median | 10.0% | 11.0% |
| Interquartile 25% (IQ1) | 8.7% | 9.4% |
| Interquartile 75% (IQ3) | 11.3% | 15.9% |
| Interquartile Range (IQR) | 2.6% | 6.5% |
| Standard Deviation (Sample) | 3.1% | 8.2% |
| Standard Deviation (Population) | 3.0% | 8.1% |
Similar Demographics by Male Disability
Demographics Similar to Afghans by Male Disability
In terms of male disability, the demographic groups most similar to Afghans are Immigrants from Kuwait (10.2%, a difference of 0.16%), Immigrants from Nepal (10.3%, a difference of 0.19%), Taiwanese (10.3%, a difference of 0.19%), Immigrants from Indonesia (10.2%, a difference of 0.33%), and Ethiopian (10.2%, a difference of 0.40%).
| Demographics | Rating | Rank | Male Disability |
| Argentineans | 99.9 /100 | #32 | Exceptional 10.1% |
| Immigrants | Ethiopia | 99.9 /100 | #33 | Exceptional 10.2% |
| Immigrants | Turkey | 99.9 /100 | #34 | Exceptional 10.2% |
| Immigrants | Argentina | 99.9 /100 | #35 | Exceptional 10.2% |
| Ethiopians | 99.8 /100 | #36 | Exceptional 10.2% |
| Immigrants | Indonesia | 99.8 /100 | #37 | Exceptional 10.2% |
| Immigrants | Kuwait | 99.8 /100 | #38 | Exceptional 10.2% |
| Afghans | 99.8 /100 | #39 | Exceptional 10.2% |
| Immigrants | Nepal | 99.8 /100 | #40 | Exceptional 10.3% |
| Taiwanese | 99.8 /100 | #41 | Exceptional 10.3% |
| Mongolians | 99.7 /100 | #42 | Exceptional 10.3% |
| Immigrants | Bangladesh | 99.7 /100 | #43 | Exceptional 10.3% |
| Immigrants | El Salvador | 99.7 /100 | #44 | Exceptional 10.3% |
| Turks | 99.7 /100 | #45 | Exceptional 10.3% |
| Cambodians | 99.7 /100 | #46 | Exceptional 10.3% |
Demographics Similar to Immigrants from Zimbabwe by Male Disability
In terms of male disability, the demographic groups most similar to Immigrants from Zimbabwe are Central American (10.8%, a difference of 0.070%), Ghanaian (10.8%, a difference of 0.090%), Immigrants from Barbados (10.8%, a difference of 0.16%), Immigrants from Uruguay (10.8%, a difference of 0.18%), and Immigrants (10.8%, a difference of 0.22%).
| Demographics | Rating | Rank | Male Disability |
| Immigrants | Syria | 94.9 /100 | #106 | Exceptional 10.8% |
| Immigrants | Eastern Africa | 94.3 /100 | #107 | Exceptional 10.8% |
| Immigrants | Belgium | 94.2 /100 | #108 | Exceptional 10.8% |
| Immigrants | Uganda | 94.0 /100 | #109 | Exceptional 10.8% |
| Immigrants | Immigrants | 93.9 /100 | #110 | Exceptional 10.8% |
| Immigrants | Uruguay | 93.8 /100 | #111 | Exceptional 10.8% |
| Ghanaians | 93.4 /100 | #112 | Exceptional 10.8% |
| Immigrants | Zimbabwe | 93.0 /100 | #113 | Exceptional 10.8% |
| Central Americans | 92.7 /100 | #114 | Exceptional 10.8% |
| Immigrants | Barbados | 92.2 /100 | #115 | Exceptional 10.8% |
| Immigrants | South Africa | 91.8 /100 | #116 | Exceptional 10.8% |
| Eastern Europeans | 90.6 /100 | #117 | Exceptional 10.9% |
| Immigrants | Cuba | 90.2 /100 | #118 | Exceptional 10.9% |
| Armenians | 90.1 /100 | #119 | Exceptional 10.9% |
| Immigrants | Africa | 89.4 /100 | #120 | Excellent 10.9% |