Tlingit-Haida vs Immigrants from Eritrea Disability
COMPARE
Tlingit-Haida
Immigrants from Eritrea
Disability
Disability Comparison
Tlingit-Haida
Immigrants from Eritrea
13.5%
DISABILITY
0.0/ 100
METRIC RATING
309th/ 347
METRIC RANK
11.0%
DISABILITY
99.7/ 100
METRIC RATING
63rd/ 347
METRIC RANK
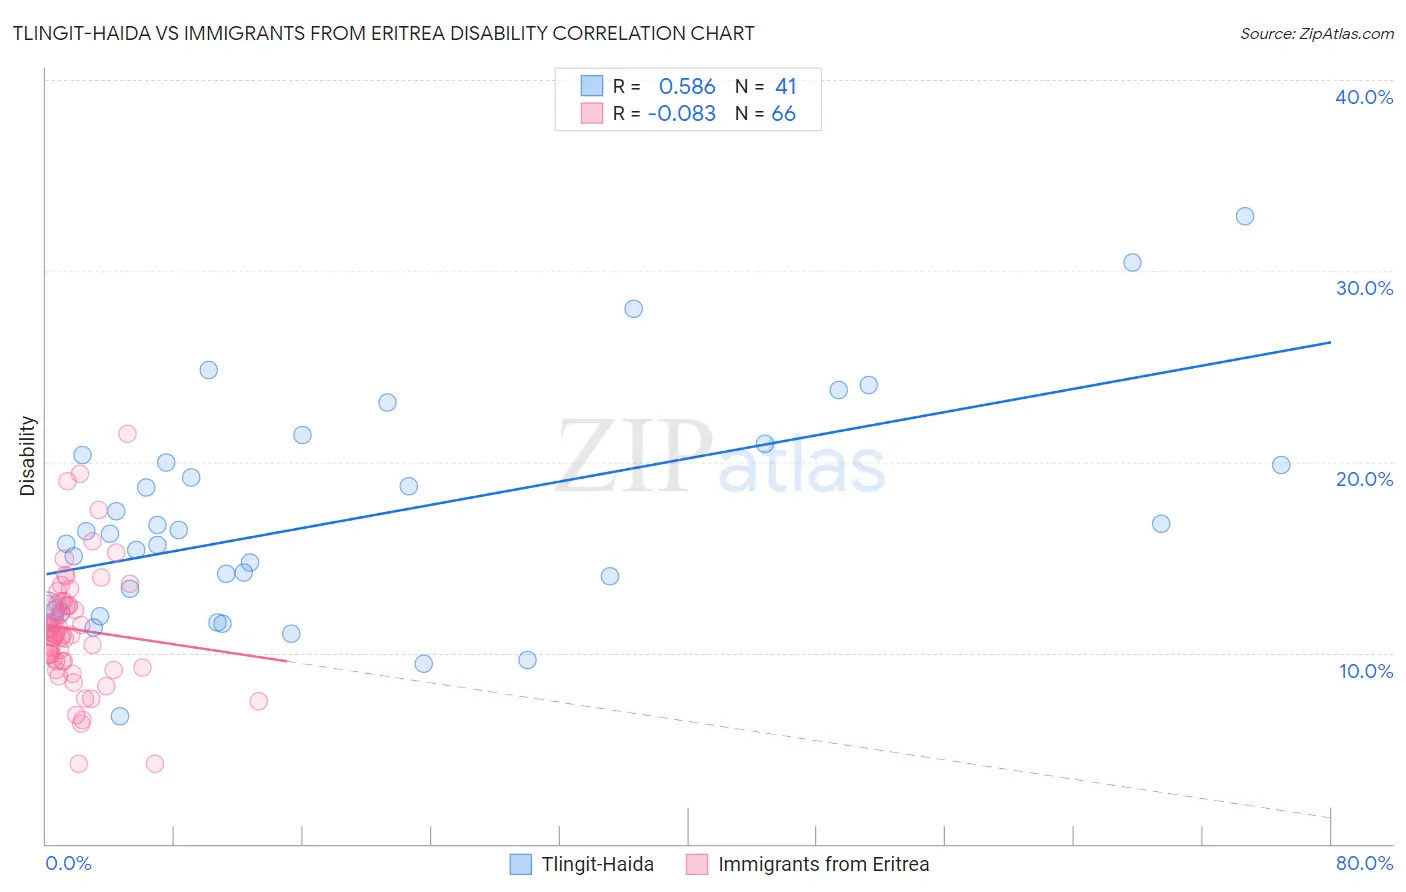
Tlingit-Haida vs Immigrants from Eritrea Disability Correlation Chart
The statistical analysis conducted on geographies consisting of 60,854,514 people shows a substantial positive correlation between the proportion of Tlingit-Haida and percentage of population with a disability in the United States with a correlation coefficient (R) of 0.586 and weighted average of 13.5%. Similarly, the statistical analysis conducted on geographies consisting of 104,852,788 people shows a slight negative correlation between the proportion of Immigrants from Eritrea and percentage of population with a disability in the United States with a correlation coefficient (R) of -0.083 and weighted average of 11.0%, a difference of 23.6%.
Disability Correlation Summary
| Measurement | Tlingit-Haida | Immigrants from Eritrea |
| Minimum | 6.7% | 4.2% |
| Maximum | 32.8% | 21.4% |
| Range | 26.1% | 17.2% |
| Mean | 17.0% | 11.2% |
| Median | 16.3% | 10.9% |
| Interquartile 25% (IQ1) | 12.2% | 9.6% |
| Interquartile 75% (IQ3) | 20.2% | 12.6% |
| Interquartile Range (IQR) | 8.0% | 3.0% |
| Standard Deviation (Sample) | 5.7% | 3.2% |
| Standard Deviation (Population) | 5.7% | 3.1% |
Similar Demographics by Disability
Demographics Similar to Tlingit-Haida by Disability
In terms of disability, the demographic groups most similar to Tlingit-Haida are French American Indian (13.5%, a difference of 0.080%), Shoshone (13.5%, a difference of 0.18%), Cape Verdean (13.5%, a difference of 0.23%), Blackfeet (13.6%, a difference of 0.53%), and Delaware (13.6%, a difference of 0.56%).
| Demographics | Rating | Rank | Disability |
| Arapaho | 0.0 /100 | #302 | Tragic 13.2% |
| Scotch-Irish | 0.0 /100 | #303 | Tragic 13.3% |
| Yakama | 0.0 /100 | #304 | Tragic 13.4% |
| French Canadians | 0.0 /100 | #305 | Tragic 13.4% |
| Cape Verdeans | 0.0 /100 | #306 | Tragic 13.5% |
| Shoshone | 0.0 /100 | #307 | Tragic 13.5% |
| French American Indians | 0.0 /100 | #308 | Tragic 13.5% |
| Tlingit-Haida | 0.0 /100 | #309 | Tragic 13.5% |
| Blackfeet | 0.0 /100 | #310 | Tragic 13.6% |
| Delaware | 0.0 /100 | #311 | Tragic 13.6% |
| Spanish Americans | 0.0 /100 | #312 | Tragic 13.6% |
| Cree | 0.0 /100 | #313 | Tragic 13.7% |
| Blacks/African Americans | 0.0 /100 | #314 | Tragic 13.7% |
| Puget Sound Salish | 0.0 /100 | #315 | Tragic 13.7% |
| Pima | 0.0 /100 | #316 | Tragic 13.7% |
Demographics Similar to Immigrants from Eritrea by Disability
In terms of disability, the demographic groups most similar to Immigrants from Eritrea are Immigrants from Northern Africa (10.9%, a difference of 0.020%), Immigrants from Bulgaria (10.9%, a difference of 0.060%), Zimbabwean (10.9%, a difference of 0.11%), Immigrants from Sweden (11.0%, a difference of 0.18%), and Bulgarian (11.0%, a difference of 0.20%).
| Demographics | Rating | Rank | Disability |
| Immigrants | Lithuania | 99.8 /100 | #56 | Exceptional 10.9% |
| Salvadorans | 99.8 /100 | #57 | Exceptional 10.9% |
| Immigrants | South America | 99.8 /100 | #58 | Exceptional 10.9% |
| Immigrants | Colombia | 99.7 /100 | #59 | Exceptional 10.9% |
| Zimbabweans | 99.7 /100 | #60 | Exceptional 10.9% |
| Immigrants | Bulgaria | 99.7 /100 | #61 | Exceptional 10.9% |
| Immigrants | Northern Africa | 99.7 /100 | #62 | Exceptional 10.9% |
| Immigrants | Eritrea | 99.7 /100 | #63 | Exceptional 11.0% |
| Immigrants | Sweden | 99.6 /100 | #64 | Exceptional 11.0% |
| Bulgarians | 99.6 /100 | #65 | Exceptional 11.0% |
| Laotians | 99.6 /100 | #66 | Exceptional 11.0% |
| Colombians | 99.6 /100 | #67 | Exceptional 11.0% |
| Immigrants | Afghanistan | 99.6 /100 | #68 | Exceptional 11.0% |
| Sri Lankans | 99.5 /100 | #69 | Exceptional 11.0% |
| Immigrants | France | 99.4 /100 | #70 | Exceptional 11.0% |